
Data Center Air Quality Monitoring: Construction and Community
- July 3, 2026
- · 12 min read
- · Aethair Team
The pace of data center construction has turned air quality and noise into a permitting issue. Projects that once moved quietly through local approval now meet organized scrutiny over dust during the build, generator emissions once the site is live, and the sound of cooling equipment running around the clock. According to Data Center Watch, billions of dollars in projects have been blocked or delayed by local opposition, and environmental and noise concerns rank among the reasons residents and officials raise most often.
Data center air quality monitoring matters across the full life of a site, from construction dust and worker silica exposure to operational emissions and noise at the property line. Planning it well comes down to knowing what is worth measuring, which standards and reference points apply, and why a continuous, calibrated record at the perimeter serves both the operators building these facilities and the communities living next to them.
Quick answer: Data center air quality monitoring covers two concerns. On site, construction throws off dust across the size range: coarse particulates (PM10) and total suspended particulates from earthwork and cutting, finer PM2.5 from diesel equipment, plus respirable crystalline silica in a worker's breathing zone. Silica is governed by OSHA's construction standard, 29 CFR 1926.1153, which sets a permissible exposure limit of 50 micrograms per cubic meter. At the perimeter, the question is what reaches the surrounding community: PM2.5 and nitrogen oxides from diesel backup generators, dust crossing the property line, and noise from cooling and backup power that runs 24/7. A continuous fenceline record, read alongside wind conditions, backs up permits and local rules and gives neighbors a clear answer about a site's impact. Aethair PRO measures particulates, gases, environmental conditions, and sound in one device, and Thiamis brings in any instruments already on site.
Why Data Centers Draw Air Quality and Noise Scrutiny
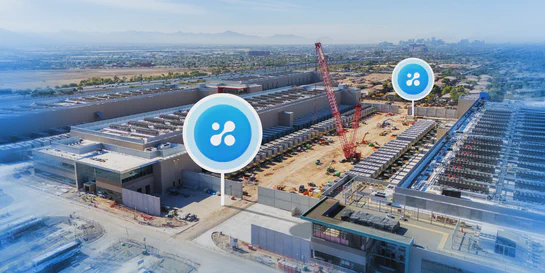
A large data center is really two projects in sequence. First comes a construction site, often on former farmland or open ground at the edge of a residential area, running months of earthmoving, foundation work, and concrete pours. Then comes a facility that never switches off, cooled by heavy mechanical systems and backed by banks of diesel generators that test on a schedule and run during grid outages. Each phase raises its own question from the people nearby, and the two rarely arrive together.
Construction brings the obvious one: dust. Local coverage of a Microsoft data center build in St. Joseph County, Indiana described dust from the site drifting into surrounding neighborhoods, thick enough to see from blocks away.
Operations bring a quieter, longer-running set of concerns. The backup generators release fine particulate matter and nitrogen oxides when they run, and the cooling systems never stop. Reporting on data center neighbors has documented residents describing a persistent low-frequency hum, and coverage of the diesel generators behind that backup power has tracked both the noise and the emissions they add. None of this is confined to a single project. Research institutions and community organizations have pressed on where data centers get built and how their emissions land on nearby populations, and the World Resources Institute has catalogued the many ways these facilities touch the communities around them.
The stakes cut both ways. For an operator, showing environmental performance with measured data has become part of winning approval and keeping a project in good standing; for a community or a municipality, independent measurement is what turns a worry into something a local government can act on.
One clarification, since the same words get used for two different things. “Data center air quality” also refers, inside the industry, to protecting servers from airborne contamination and corrosion under cleanliness classes such as ISO 14644. That is an equipment problem inside the building, and Aethair can monitor those indoor conditions too. This article is about the other side: the dust, emissions, and noise a site produces that reach the people and property around it.
On-Site Dust and Worker Exposure: The Silica Question
Before a data center affects anyone beyond its fence, it creates exposures for the people building it.
Construction air quality is mostly a dust problem. On a site with heavy concrete cutting, grinding, and earthwork, part of that dust is respirable crystalline silica, the fine fraction released when concrete, stone, and sand are broken up, and the diesel equipment moving around the site adds exhaust that is almost entirely PM2.5. Silica is the part that carries a specific legal obligation, because it falls under OSHA’s respirable crystalline silica standard for construction, 29 CFR 1926.1153. That rule sets a permissible exposure limit (PEL) of 50 micrograms of respirable crystalline silica per cubic meter of air over an 8-hour day, with an action level of 25 micrograms per cubic meter that triggers exposure assessment and medical surveillance. Employers have two routes to compliance: follow the engineering controls, work practices, and respiratory protection spelled out for each task in the standard’s Table 1, or assess worker exposures directly and control them to the PEL.
What sets silica apart comes down to where you measure. It is a worker exposure, sampled in or near a person’s breathing zone across a shift, which is a different task from the area and perimeter monitoring used to gauge community impact. Most data center projects have to handle both at once: protecting workers under the OSHA standard through the build, and measuring dust at the boundary to answer for what leaves the site. Our article on OSHA air quality standards and how to stay compliant covers the workplace side and permissible exposure limits in more detail.
Perimeter and Community Impact
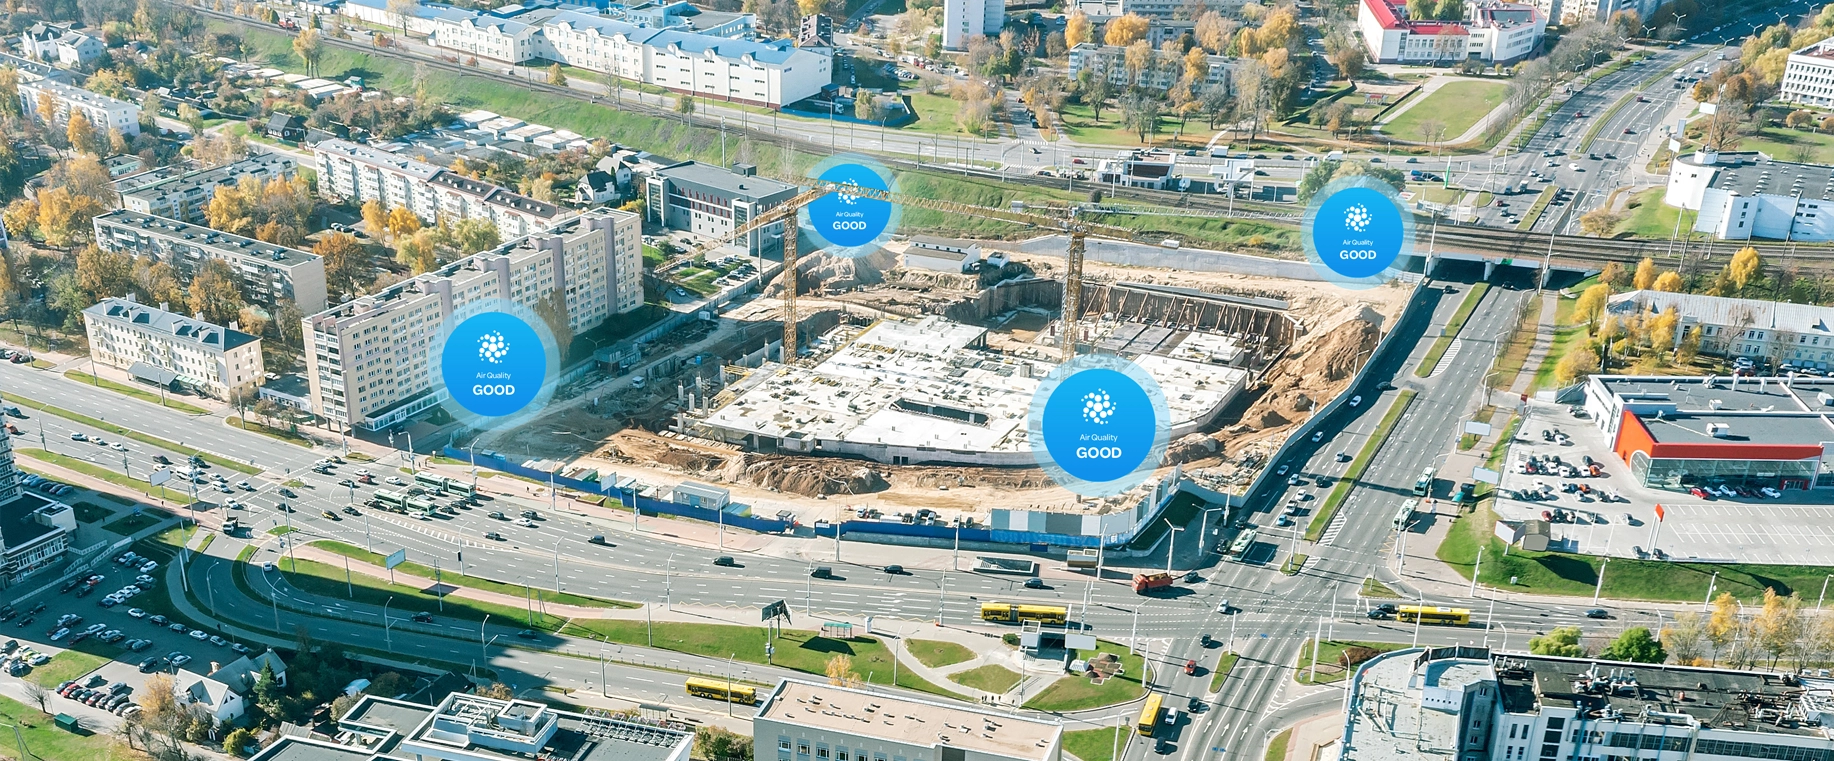
Perimeter monitoring, also called fenceline monitoring, measures air quality at the boundary of a site to see what is crossing it. For a data center, that boundary is where construction and operational concerns turn into a community question, and where measured data either backs up a claim or settles a dispute.
Through construction, the parameters that carry the most weight are coarse particulates (PM10) and total suspended particulates, the indicators tied to visible dust from earthwork and demolition. PM2.5 matters throughout, and it moves to the front once a facility runs, because diesel backup generators emit PM2.5 and nitrogen oxides during testing and operation. The reference points are the EPA’s National Ambient Air Quality Standards (NAAQS), which set ambient limits for PM10, PM2.5, and nitrogen dioxide that local permits and air districts frequently build on.
Wind is what gives a perimeter reading meaning. A PM10 spike at the eastern edge of a site says one thing when the wind is blowing from the site toward that monitor and something else entirely when the air is still or moving the other way. Measuring wind speed and direction next to the air data is what lets a reading be pinned to the site rather than to a passing truck, a neighboring field, or a nearby road, which is exactly the question a regulator or a resident will ask.
Noise belongs in the same conversation, and it is the harder one to pin down. Cooling systems and backup generators run continuously, and the complaint neighbors raise most is not a single loud event but a constant low-frequency hum. Local noise ordinances tend to set limits somewhere around 50 to 65 decibels and were written with ordinary noise in mind, so the steady low-frequency sound a data center produces can slip past them. Measuring sound continuously at the perimeter, next to the air data, at least gives a site and its neighbors a shared record to reason from, even while the science of low-frequency noise keeps developing.
The case for doing all of this continuously, rather than through the occasional survey, follows from how the conditions behave. They change hour to hour with weather, activity, and generator tests, so a quarterly snapshot rarely lands on the moment that matters, and a continuous record is the version that holds up when someone challenges it. Our article on what perimeter air quality monitoring means for a project goes deeper on fenceline programs and the rules behind them.
What to Monitor at a Data Center Site
Which parameters matter most changes between the construction phase and operations, but one perimeter deployment can cover both. The table below sums up what each parameter indicates at a data center site and the reference point commonly used to judge it.
| Parameter | What it indicates at a data center site | Common reference point |
|---|---|---|
| Coarse particulates (PM10) | Construction and demolition dust crossing the perimeter | NAAQS 24-hour PM10 limit of 150 µg/m³ |
| Fine particulates (PM2.5) | Diesel equipment and generator combustion; long-term health concern | NAAQS 24-hour PM2.5 limit of 35 µg/m³ |
| Respirable crystalline silica | Worker exposure from concrete and stone work on site | OSHA PEL 50 µg/m³; action level 25 µg/m³ |
| Nitrogen dioxide (NO2) | Diesel generators and heavy equipment exhaust | NAAQS limits for ambient NO2 |
| Noise (sound level) | 24/7 cooling and generator operation, construction equipment | Local ordinances, commonly 50 to 65 dB |
| Wind speed and direction | Whether a reading can be attributed to the site | Context for everything above, not a limit |
Two things stand out. The same site has two audiences for its data: silica is a worker number, sampled in a breathing zone, while the particulate, gas, and noise readings at the perimeter speak to the community. A plan that covers only one leaves the other question open.
No single parameter stands on its own either. A particulate reading without wind, or a noise reading without a time stamp, invites the argument it was meant to end. The value is in one complete, continuous, time-stamped record.
How Aethair PRO Supports Data Center Air Quality and Noise Monitoring
Aethair treats a data center site as one monitoring problem with several parameters rather than a separate box for each. Aethair PRO is well suited to monitoring environmental conditions around these sites, measuring particulates (PM1, PM2.5, and PM10), temperature, pressure, humidity, light, and sound in one weather-resistant, solar-capable unit, along with up to two gas sensors chosen for the site, such as nitrogen dioxide, carbon monoxide, or volatile organic compounds. It can be supplemented by third-party instrumentation integrated into the Aethair Platform through Thiamis, so a contractor’s existing dust monitors or a weather station feed into the same place as the rest of the data.
Wind is the reason that weather station earns its place. A perimeter reading only means something when it is read against the wind, so wind data usually comes from a meteorological sensor integrated through Thiamis.
A line of Aethair PRO units spaced along a boundary adds a second way to find a source: when a value climbs on one unit but not the others, the pattern across the fenceline points back toward where the dust or exhaust is coming from. All of it reports into Environet, the web-based platform at the center of Aethair’s environmental intelligence approach, where live and historical readings sit together and are visible from a desktop or a phone. Teams can set intelligent alerts against a defined threshold, single-condition or built from several parameters at once, so the right person hears about a problem during a pour, a windy afternoon, or a generator test instead of after a complaint.
For the documentation that permits, air districts, and community agreements ask for, Aethair Reports turns the record into clear reports on demand or on a schedule, and Noesis, Aethair’s AI analysis tool, helps teams work through trends and exceedances and put them in plain language. Because every figure traces back to a calibrated measurement, one dataset answers for all sides: an operator demonstrating dust control, a municipality checking a permit condition, or a community group asking a plain question about the air next door. Aethair supplies the measurement and the documentation. The decisions about siting, controls, and compliance stay with the parties responsible for them.
Data Center Air Quality Monitoring: Frequently Asked Questions
What air quality concerns do data centers create for nearby communities?
The concerns arrive in two phases. During construction, earthmoving, demolition, and concrete work raise dust, measured as coarse particulates (PM10) and total suspended particulates, with finer PM2.5 coming off diesel equipment and respirable crystalline silica affecting workers on site. Once a facility runs, attention shifts to the diesel backup generators, which release PM2.5 and nitrogen oxides when they test and operate, and to the steady noise of cooling systems and generators. Perimeter monitoring measures these at the property line, so whether a site is affecting the surrounding area is settled with data instead of argument.
What is data center perimeter air quality monitoring?
Perimeter monitoring, also called fenceline monitoring, places continuous air quality monitors along the boundary of a site to measure what is leaving it. For a data center that usually means PM10 and PM2.5, gases such as nitrogen dioxide, and the wind conditions that determine whether a reading came from the site or from a road, a farm, or a neighbor. The result is a continuous, time-stamped record that supports permits, local air rules, and community reporting. Our article on perimeter air quality monitoring goes into the frameworks behind it.
Does OSHA require silica monitoring on data center construction sites?
OSHA’s respirable crystalline silica standard for construction, 29 CFR 1926.1153, applies to a data center build like any other construction project. It sets a permissible exposure limit of 50 micrograms per cubic meter of air as an 8-hour average, and an action level of 25 micrograms per cubic meter that triggers exposure assessment and medical surveillance obligations. Employers either follow the controls listed for each task in the standard’s Table 1 or assess worker exposures directly. Silica is a worker exposure, sampled in a person’s breathing zone, which is a separate question from the dust measured at the perimeter.
Can air quality monitors also measure noise from a data center?
Some can. Aethair PRO carries a sound sensor alongside its particulate, gas, and environmental sensors, so a single unit at the perimeter records air quality and noise together. That combination matters at a data center, where noise is among the most common complaints, driven by cooling and generators that run continuously. Standard sound measurement does not fully capture the low-frequency hum residents tend to report, so noise data reads best as one signal in a wider monitoring picture rather than a full acoustic study on its own.
Is data center air quality monitoring for operators or for communities?
Both, and the same dataset often serves each. Operators and their contractors use it to document dust control during construction, back up air permit applications, and show they are meeting the conditions attached to approval. Municipalities and community groups use it to check that a nearby facility is staying inside agreed limits. Because the data only carries weight if it is calibrated and traceable, a shared, transparent record tends to lower the temperature between a facility and its neighbors rather than raise it.
For the worker exposure side of construction air quality, including permissible exposure limits, read our article on OSHA air quality standards and how to stay compliant. For fenceline programs and the rules behind them, see what perimeter air quality monitoring means for your project. And for the pollutant at the center of the community conversation, our article on PM2.5 monitoring, health impacts, and regulatory limits covers it in depth.