

How to Generate Air Quality and Environmental Compliance Reports
- June 4, 2026
- · 12 min read
- · Aethair Team
Generating an air quality or environmental report is the step where monitoring data finally has to earn its keep. A facility can run calibrated sensors around the clock, but a database full of readings does little until it becomes a report that holds up to outside scrutiny. For the EHS and sustainability teams who own that step, the work is less about collecting data than about turning it into air quality and environmental reports, on the schedule regulators and stakeholders expect, without losing a week to manual assembly each cycle.
Most of the friction lands between the readings and the finished document. Numbers come off different devices in different formats, each standard wants its own averaging period and threshold, and any figure in the report has to trace back to the reading that produced it. Done by hand, that is slow and easy to get wrong. This is the work automated reporting takes off the table, and where AI has started to handle the analysis that used to eat an analyst’s afternoon. The sections below cover what a defensible report contains and how to produce one without the manual grind.
Quick answer: Generating an air quality or environmental report means pulling readings from calibrated monitors into one place, applying the thresholds that govern your site, flagging any exceedances, and formatting the result into a defensible, date-stamped document. Aethair is built to do this end to end: its monitors feed the Environet platform, and Aethair Reports generates automated, audit-ready reports on a schedule, turning what is usually a manual job into a defensible output.
What Goes Into an Air Quality Compliance Report?
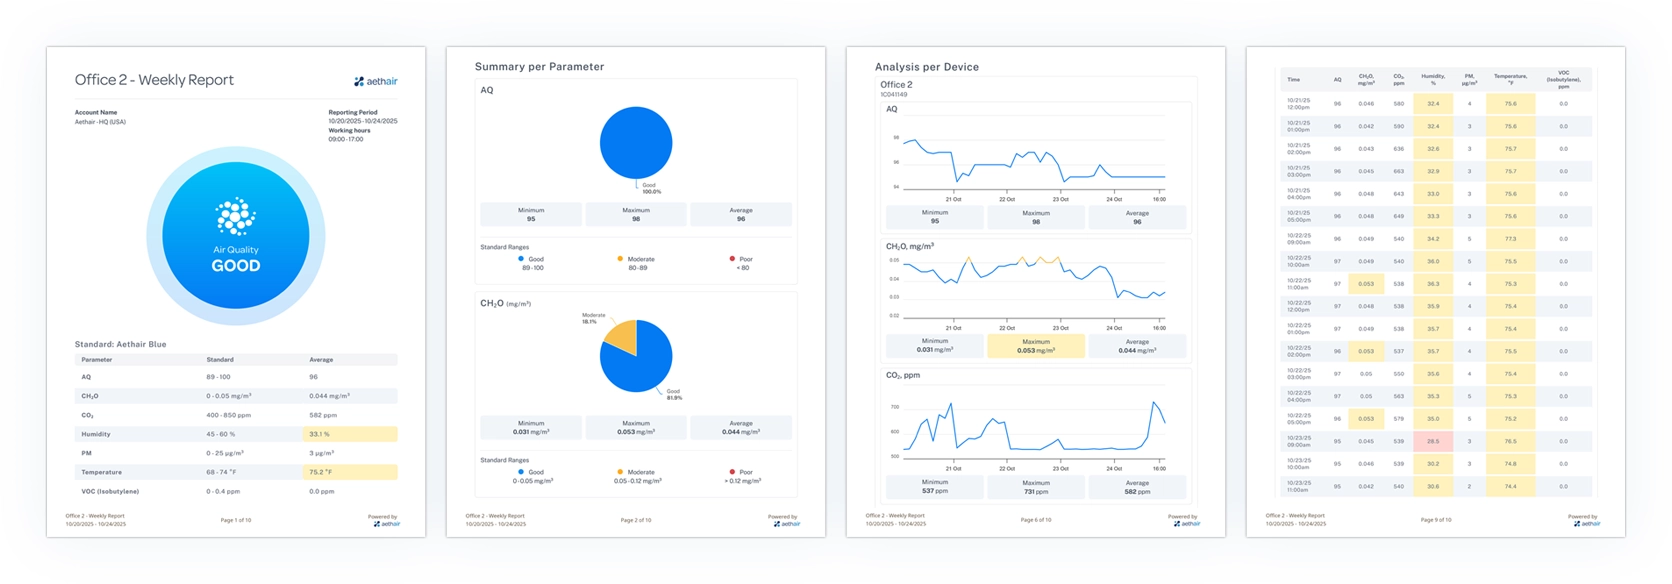
Before automating anything, it helps to know what a complete report contains. A compliance report is a factual record that connects measured conditions to the standards that apply, in a form an auditor or regulator can follow without anyone walking them through it.
A defensible air quality data report generally includes the monitoring location and the reporting period, the parameters measured (particulates like PM1, PM2.5, and PM10, along with gases and other environmental parameters), and the instruments used along with their calibration status. It documents the thresholds applied, whether regulatory or internal, the summary statistics and time-weighted averages, and a record of any exceedances with timestamps. Underneath those figures sits the supporting data, raw or aggregated, that each summary value is drawn from.
What separates a report from a spreadsheet is data lineage: a clear trail showing where each number originated, which device produced it, and how it was processed. That traceability is what makes a report defensible when someone asks how a figure was reached. Our article on moving from data collection to defensible documentation covers this distinction in depth.
How to Generate Air Quality Reports: A Repeatable Workflow
Producing reports consistently comes down to having a workflow you can repeat each cycle rather than rebuild from scratch. The same five steps apply whether you report monthly to a corporate ESG team or on demand to a regulator.
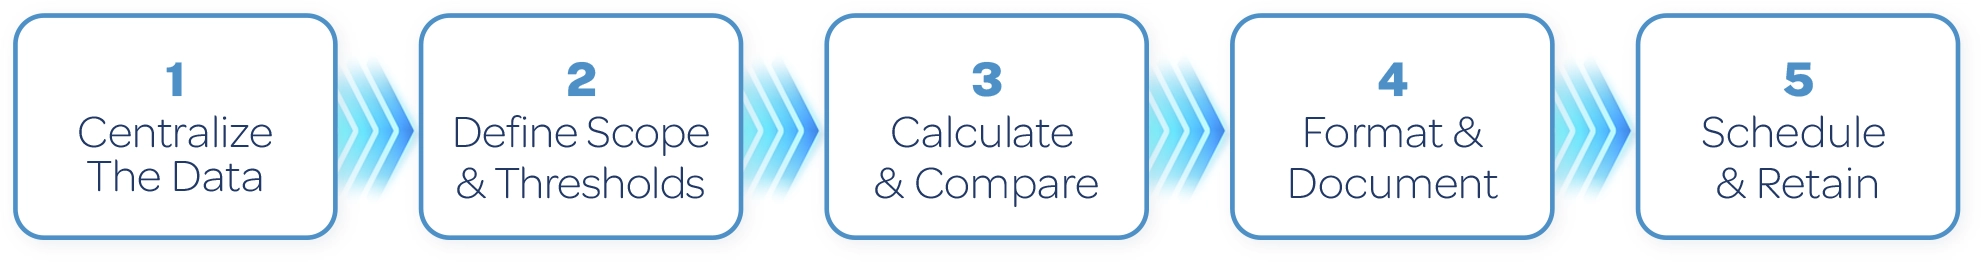
1. Centralize the data
Bring readings from every monitor into a single system of record. When data lives in separate device exports and disconnected spreadsheets, reconciling it eats most of the reporting effort and invites transcription errors. A platform that stores continuous readings removes that step entirely.
2. Define scope and thresholds
Select the location, parameters, and date range for the report, then apply the limits that govern them. The same dataset can back an OSHA exposure assessment one week and an ESG summary the next, because each use applies its own thresholds and averaging periods to the same readings.
3. Calculate and compare
Compute the averages each standard calls for, such as 8-hour time-weighted averages for occupational exposure or 24-hour means for fine particulates like PM2.5, then compare them against the configured limits. Exceedances should be caught and timestamped automatically, not spotted by eye on a chart.
4. Format and document
Assemble the figures, charts, and tables into a consistent layout. This matters more than it looks: a report that follows the same shape every period is far easier to review and to defend later.
5. Schedule and retain
Set reports to generate on whatever cadence your obligations require, and retain them for the mandated period. OSHA’s access to exposure records rule, 29 CFR 1910.1020, requires employers to keep exposure monitoring records for at least 30 years, so the archive matters as much as the current report.
What Is Automated Environmental Reporting?
Automated environmental reporting generates environmental data reports straight from continuous monitoring systems, without manually exporting data or rebuilding documents each cycle. Sensors stream readings to a central platform that calculates averages and exposure times, checks values against the limits you configure, and produces reports on a schedule or on demand.
The shift from manual to automated reporting changes the economics of compliance documentation. Done by hand, the work grows with the operation: every new site, parameter, or reporting cycle adds hours of data handling. Automated reporting absorbs that growth, because the platform applies the same logic to any volume of data. It also keeps every report calculated and formatted the same way, and it shortens the time between a question and a documented answer. When an auditor asks for last quarter’s particulate data on a specific zone, the report either already exists or can be produced in minutes.
What Reporting Do OSHA, NAAQS, and WELL Require?
Different frameworks govern different environments, and a single facility often answers to more than one. It helps to be clear about what each actually requires, because the word “reporting” means something different in each case.
| Framework | What it governs | What it expects |
|---|---|---|
| OSHA | Workplace exposure to air contaminants via permissible exposure limits (PELs) | Exposure assessment against PELs and retention of exposure monitoring records for at least 30 years under 29 CFR 1910.1020 |
| NAAQS (EPA) | Ambient outdoor air for the six criteria pollutants under the Clean Air Act | Reference limits (PM, ozone, CO, NO₂, SO₂, lead) that permits, state plans, and air-district rules adopt as the basis for their own monitoring and reporting |
| WELL Building Standard | Indoor air quality in occupied buildings (WELL v2 Air concept) | Air quality testing against WELL thresholds for certification, with continuous monitoring available as a pathway for ongoing verification |
| ESG frameworks | Corporate environmental disclosure | Defensible environmental metrics with transparent calculation and clear data lineage for stakeholder and investor reporting |
Not all of these mandate reporting in the same sense. OSHA permissible exposure limits are enforceable workplace ceilings, mostly written as 8-hour time-weighted averages, and the agency requires employers to retain exposure records for decades and produce them on request. NAAQS, by contrast, are the EPA’s ambient standards for outdoor air; they set the reference levels, while the actual reporting obligations flow from the permits and programs built on top of them, including the EPA’s Air Emissions Reporting Requirements and, for larger emitters, the Greenhouse Gas Reporting Program under 40 CFR Part 98. The WELL Building Standard, used for healthy-building certification, calls for air quality testing against its thresholds and lets teams use continuous monitoring as the verification pathway, which our article on WELL air quality monitoring requirements walks through in detail. Many internal and ESG programs then layer their own thresholds on top, often borrowing from these same frameworks. Sustainability disclosure points the same direction: the GRI Standards include an emissions disclosure (GRI 305-7) covering nitrogen oxides, sulfur oxides, and other significant air emissions, the kind of quantified, auditable data continuous monitoring is built to produce. One practical caveat: continuous sensors cover the gaseous and particulate criteria pollutants directly, while lead is determined by filter sampling and laboratory analysis rather than real-time measurement. The variety of requirements is the reason a reporting platform has to let you configure thresholds and averaging periods rather than hard-code a single standard. For workplace specifics, see our article on OSHA air quality standards and permissible exposure limits.
How AI Supports Air Quality Reporting
AI air quality reporting uses analysis tools to summarize monitoring data, surface trends, and draft report narratives in plain language. For teams working across multiple sites and long time periods, reading through the data and writing it up by hand is where the hours go, and that is the part AI takes on. In the Aethair platform, Noesis handles it: teams ask questions of their data and get sourced answers back, and the same tool can generate reports from a query and set up alerts that trigger when a reading crosses a threshold.
It is worth being precise about what the AI is actually doing, because much of the skepticism around AI comes from cases where a model invents an answer. That is not the situation here. The data already exists, measured by calibrated instruments, and the AI’s job is to read, organize, and explain it rather than to produce conclusions of its own. Every figure it surfaces traces back to a real reading, which keeps the output checkable. So the role is narrow and useful: it speeds the path from a question to a documented answer, but it does not certify compliance, and the interpretation and sign-off stay with the professional accountable for them.
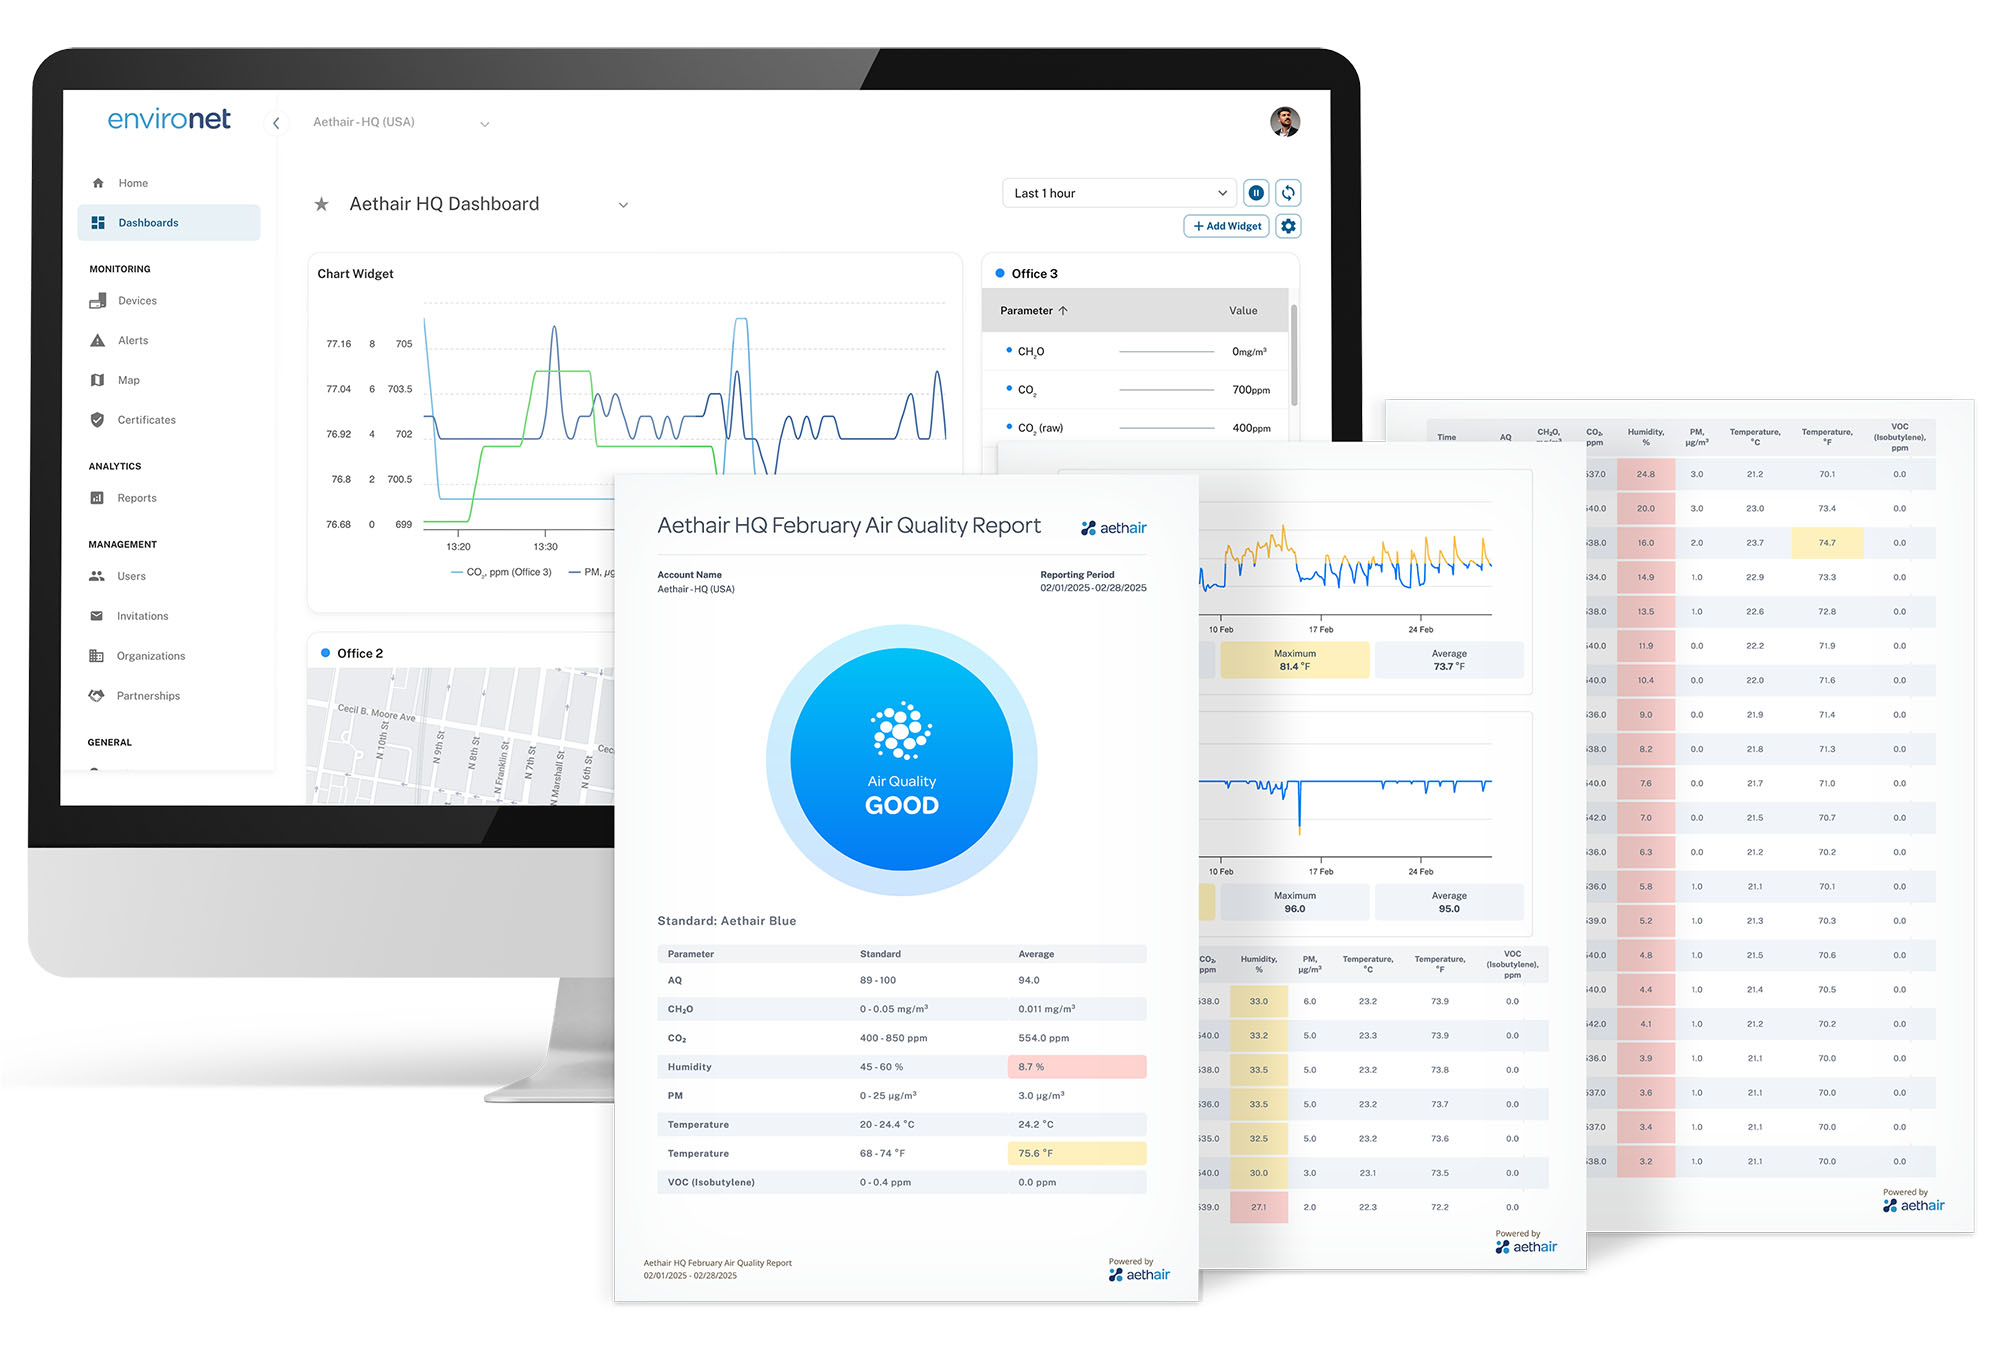
How Aethair Reports and the Environet Platform Support Automated Air Quality Reporting
Aethair was built so that environmental data moves from sensor to report without manual processing in between. Aethair IAQ and Aethair PRO devices continuously measure regulated particulate fractions and configurable gas parameters, alongside environmental conditions like temperature, humidity, and barometric pressure, with Aethair PRO also capturing light and sound. All of it feeds into Environet, the web-based environmental data management and analytics platform, which computes averages and exposure times, flags exceedances against thresholds you set, and retains the continuous record that defensible reporting depends on. Where a facility runs existing or specialized instruments, Thiamis brings those sensors in so every reading lands in one system of record.
Aethair Reports turns that stored data into the finished documents: structured, downloadable air quality and environmental reports formatted for internal review or for a regulator’s request, generated on demand or scheduled to run automatically on a daily or weekly basis. Reports can be configured to align with OSHA, NAAQS, WELL, and EPA reference values, applying the right limits and averaging periods to the same underlying data.
Noesis, Aethair’s AI analysis tool, sits alongside the reporting and handles the analysis. Teams can query their environmental data in plain language and generate summaries on demand. That can mean working at the level of a single report, or going wider to analyze raw data from many devices across a chosen time period, which is where patterns across sites or seasons tend to show up. As with any analysis tool, Noesis surfaces and explains what the data shows; the interpretation and final sign-off remain with the team. Continuous measurement, configurable limits, and automated generation give EHS and ESG teams a defensible path from real-world readings to audit-ready air quality reporting.
Air Quality & Environmental Reporting: Frequently Asked Questions
How do I generate air quality reports?
Generate air quality reports by pulling readings from calibrated monitors into one platform, choosing the parameters, location, and date range you need to document, and applying the thresholds that govern your facility. The platform compares the measured values against those limits, flags any exceedances, and outputs a structured, date-stamped report with the supporting data behind each figure. Automated tools such as Aethair Reports run this on a schedule, so the documentation is ready without manual data handling.
What is automated environmental reporting?
Automated environmental reporting generates environmental data reports straight from continuous monitoring systems, without manually exporting spreadsheets or rebuilding documents each cycle. Sensors stream readings to a central platform that calculates averages and exposure times, checks values against the limits you set, and produces reports on a schedule or on demand. The result is consistent formatting, a clear data trail, and much faster turnaround when someone asks for documentation. Aethair Reports is one tool that automates this end to end.
What goes into an air quality compliance report?
An air quality compliance report usually covers the monitoring location and period, the parameters measured (particulates like PM2.5 and PM10, along with gases and other environmental conditions), the instruments used and their calibration status, the thresholds applied, summary statistics and time-weighted averages, and a record of any exceedances with timestamps. Behind those figures sits the raw or aggregated data each value is drawn from. That data lineage, showing where every number came from, is what makes the report defensible during an audit.
How do you automate environmental compliance reporting?
Automate environmental compliance reporting by connecting calibrated monitors to a platform that stores readings continuously, configuring report templates aligned to the standards you report against, setting the thresholds and averaging periods each standard requires, and scheduling reports to generate and deliver on their own. With Aethair, devices feed data into Environet, which computes averages and flags exceedances, while Aethair Reports produces the scheduled outputs and Noesis lets teams query the underlying data in plain language.
What reporting do OSHA, NAAQS, and WELL require?
These frameworks set the limits and recordkeeping that reporting is built around, though only some require reporting directly. OSHA requires employers to assess worker exposure against permissible exposure limits and to keep exposure monitoring records for at least 30 years under 29 CFR 1910.1020. NAAQS are the EPA’s ambient outdoor limits for the six criteria pollutants; facility-level reporting usually comes from the permits and programs that adopt those limits, such as the EPA’s Air Emissions Reporting Requirements and Greenhouse Gas Reporting Program, rather than from NAAQS itself. The WELL Building Standard calls for air quality testing against its v2 Air thresholds for certification, with continuous monitoring available as a verification pathway.
What is AI air quality reporting?
AI air quality reporting uses analysis tools to summarize monitoring data, surface trends, and draft report narratives in plain language, which cuts the manual effort of working through large datasets. Because it works from measured readings that already exist, the tool interprets real data rather than generating answers on its own, so its output stays traceable to the source. Noesis, Aethair’s AI analysis tool, lets EHS and ESG teams query their environmental data conversationally, whether that means asking about one report or analyzing raw data from many devices over a chosen period. The judgment and sign-off stay with the team.
For the broader picture of how environmental data becomes defensible regulatory output, read our article on EHS compliance reporting. For workplace exposure thresholds specifically, our article on OSHA air quality standards covers the limits and recordkeeping rules in detail. And for how monitoring, analysis, and reporting fit together as one system, see what environmental intelligence means in practice.