
Ozone is the pollutant most likely to be measured in the wrong place. Every other contaminant an EHS team tracks is emitted by something: a stack, an engine, a process, a material. Ozone is not emitted at all. It is formed in the air itself, from nitrogen oxides and volatile organic compounds reacting in sunlight, which means it peaks in the afternoon rather than at shift start, rises downwind rather than at the source, and is destroyed by the very combustion emissions people expect to find it near.
That has consequences for anyone applying ozone exposure limits, because the limits themselves do not agree on what to measure. The OSHA permissible exposure limit is an 8-hour average. The NIOSH recommendation, at the same number, is an instantaneous ceiling. The ambient standard is lower than both. This article covers what each one requires, where occupational ozone exposure actually happens, and why an eight-hour sample can return a compliant number on a shift that contained a serious exposure.
Ozone Exposure Limits: What OSHA, NIOSH, and ACGIH Set
Four organizations publish ozone limits, and they do not agree on the form the limit should take. That disagreement matters more than the numbers.
| Source | Limit | Form |
|---|---|---|
| OSHA PEL (general industry and construction) | 0.1 ppm (0.2 mg/m³) | 8-hour time-weighted average |
| NIOSH REL | 0.1 ppm (0.2 mg/m³) | Ceiling, not to be exceeded at any time |
| NIOSH IDLH | 5 ppm | Immediately dangerous to life or health |
| ACGIH TLV, heavy work | 0.05 ppm (0.10 mg/m³) | 8-hour TWA |
| ACGIH TLV, moderate work | 0.08 ppm (0.16 mg/m³) | 8-hour TWA |
| ACGIH TLV, light work | 0.10 ppm (0.20 mg/m³) | 8-hour TWA |
| ACGIH TLV, any workload for 2 hours or less | 0.20 ppm (0.39 mg/m³) | Short-duration work |
The OSHA figure sits in Table Z-1 of 29 CFR 1910.1000 (opens in a new tab) and, at the same value, in Table 1 to 29 CFR 1926.55 (opens in a new tab) for construction. Because the entry carries no "C" prefix, it is an 8-hour time-weighted average rather than a ceiling.
There is no current federal short-term exposure limit for ozone, and this trips people up. OSHA's 1989 Air Contaminants rule did set a 0.3 ppm STEL alongside the 0.1 ppm TWA, but the Eleventh Circuit vacated that rule in 1992 and OSHA reverted to the earlier limits in 1993. The NIOSH Pocket Guide notes the vacatur explicitly (opens in a new tab). OSHA's own sampling method ID-214 still prints the 0.3 ppm figure, which is a stale reference rather than a live limit. California is the exception worth knowing. Cal/OSHA's airborne contaminants table at 8 CCR 5155 (opens in a new tab) retains both a 0.10 ppm eight-hour PEL and a 0.30 ppm STEL for ozone, as reproduced in OSHA's annotated exposure limit tables (opens in a new tab). Employers in California therefore have a short-term ozone limit that federal employers do not.
NIOSH's approach is the more instructive one. Its recommended exposure limit is C 0.1 ppm (opens in a new tab), the same concentration expressed as a ceiling. Read together, the two federal positions say that 0.1 ppm is simultaneously an acceptable eight-hour average and a concentration that should never be reached. The two framings lead to very different programs: which one a monitoring program assumes determines what it is capable of detecting.
ACGIH goes further (opens in a new tab) by scaling its threshold limit values to workload. Heavy work drops the value to 0.05 ppm, half the OSHA PEL. ACGIH also publishes a separate value of 0.20 ppm for work lasting two hours or less, building into the limit structure itself the acknowledgment that duration and concentration are not interchangeable.
The Ambient Standard: EPA's Ozone NAAQS
The National Ambient Air Quality Standard for ozone is 0.070 ppm, or 70 ppb, set in 2015 (opens in a new tab) and codified at 40 CFR 50.19 (opens in a new tab). Both the primary and secondary standards sit at that level. Attainment is assessed as the annual fourth-highest daily maximum 8-hour average concentration, averaged over three consecutive years, which is a deliberately smoothed metric designed to tolerate isolated bad days while catching persistent problems.
EPA retained the 2015 level in its 2020 review, opened a new review in August 2023, and published Integrated Review Plan volumes in December 2024. As of August 2026 no draft Integrated Science Assessment, policy assessment, or proposed rule has been issued, so there is no proposed change to the level.
Nonattainment is where the ambient standard becomes an operational concern. EPA's Green Book, current as of July 31, 2026, lists 47 nonattainment areas covering 181 counties under the 2015 standard, with a combined population of just over 117 million on a 2010 Census basis. Facilities in those areas face permitting scrutiny and state implementation plan obligations that facilities elsewhere do not. Understanding local conditions relative to the standard starts with continuous outdoor monitoring at the site itself.
The gap between the two frameworks deserves attention. The ambient standard for outdoor air is 70 ppb. The workplace limit is 100 ppb. Ozone is one of the few contaminants where the general-population standard is stricter than the occupational one, and EPA's own exposure research explains why that ordering is not as strange as it looks. In controlled human exposure studies, EPA describes an average outdoor laborer doing intermittent work (opens in a new tab) as likely to experience "small to moderate lung function and symptom effects as well as lung injury and inflammation" following an eight-hour exposure at 60 to 70 ppb. The 2020 Integrated Science Assessment found reduced lung function and increased pulmonary inflammation in exercising subjects at concentrations as low as 60 ppb.
Those are effects observed below the ambient standard and well below the OSHA PEL. People most at risk, per EPA, include those with asthma, children, older adults, and people who are active outdoors, particularly outdoor workers.
Why Ozone Behaves Differently From the Pollutants You Already Monitor
Formed, Not Emitted
EPA's description is direct. Ground-level ozone "is not emitted directly into the air, but is created by chemical reactions between oxides of nitrogen (NOx) and volatile organic compounds (VOC)" when emissions from vehicles, power plants, boilers, refineries, and chemical plants react in sunlight. Peak concentrations follow the sun, arriving in the afternoon rather than at shift start. And because the reaction takes time, the ozone shows up somewhere other than where the precursors were released. EPA puts the consequence plainly (opens in a new tab): "Ozone can also be transported long distances by wind, so even rural areas can experience high ozone levels." A county with no significant emissions of its own can still have an ozone problem.
Regulators have built the seasonality into the monitoring rules. 40 CFR part 58, Appendix D (opens in a new tab) sets a required ozone monitoring season state by state: year-round in Arizona, California, Colorado, Florida, Hawaii, Nevada, New Mexico, Utah, and parts of Louisiana and Texas, shorter windows elsewhere.
Do not read that as permission to stop looking in winter. EPA's own guidance keeps the caveat that ozone "can still reach high levels during colder months," and cold-season ozone in oil and gas basins is well documented.
Where Ozone Peaks, and Where It Disappears
Ozone reacts readily with nitric oxide. Fresh combustion emissions therefore destroy it, and concentrations are suppressed close to roadways, engine exhaust, forklift traffic, and combustion stacks, then rise downwind as the reaction products go on to form ozone again. EPA's probe siting rules in 40 CFR part 58, Appendix E (opens in a new tab) state the reasoning plainly: "It is important to minimize destructive interferences from sources of NO, since NO readily reacts with O₃." Peer-reviewed work on urban ozone patterns describes the same effect as local suppression near NO sources in the urban core with subsequent formation downwind.
EPA translates this into required setbacks, and the scale is larger than most people assume.
| Average daily traffic (vehicles per day) | Minimum probe separation from roadway |
|---|---|
| 10,000 or fewer | 10 m |
| 20,000 | 30 m |
| 40,000 | 50 m |
| 70,000 | 100 m |
| 110,000 or more | 250 m |
Appendix E also requires ozone inlets at neighborhood or larger scale to sit between 2 and 15 meters above ground, with unrestricted airflow across a continuous arc of at least 270 degrees and a minimum of 10 meters from the drip line of any tree.
For a site-level monitoring program, this is the most consequential fact in the article. A monitor placed beside a loading dock or a generator will read low, and it will be reassuring for the wrong reason. Ozone assessment requires thinking about where the plume goes, not where the emissions are, which is the same reasoning that governs perimeter air quality monitoring and action levels.
Ozone Indoors
Indoors, ozone disappears fast. Nazaroff and Weschler's 2022 review in Indoor Air (opens in a new tab), drawing on roughly two thousand measurements in homes, schools, and offices, puts typical indoor concentrations at 4 to 6 ppb, about a quarter of outdoor levels. Weschler's earlier survey (opens in a new tab) puts the indoor half-life at 7 to 10 minutes and the indoor to outdoor ratio anywhere from 0.05 in a tightly sealed, carbon-filtered building to 0.85 where air exchange is very high.
That decay is not free. Ozone does not vanish; it reacts, and what it reacts with determines what is left behind. With unsaturated indoor organics it produces aldehydes, ketones, and organic acids, formaldehyde among them, plus submicron secondary aerosol. EPA makes the same point (opens in a new tab) about ozone meeting new-carpet chemistry to form aldehydes and formic acid.
So a building that looks like it solved an ozone problem may have traded it for a formaldehyde and fine particle problem. Measure both.
Where Occupational Ozone Exposure Happens
Welding
Strike an arc and you make ozone. The ultraviolet light coming off the arc converts atmospheric oxygen directly, no consumable or coating required, which is why the exposure follows the welder rather than the material.
How much depends on the process, and here the published sources genuinely disagree. The UK Health and Safety Executive's operational circular on welding aluminum reports breathing-zone ozone during gas metal arc welding, commonly called MIG, exceeding the short-term occupational exposure standard "by up to a factor of 3," and notes that gas tungsten arc welding, or TIG, runs higher still on aluminum alloys despite producing roughly ten times less particulate fume. A 2005 NIOSH health hazard evaluation (opens in a new tab) at an oil cooler plant found the ranking reversed: MIG short-term exposures reached 0.7 ppm while TIG stayed between 0.05 and 0.1 ppm.
Both are above the limits. Which is worse depends on alloy, shielding gas, and current, so a monitoring program that watches only one process is guessing.
The HSE circular also contains a control note worth reading twice. Particulate fume partially shields the arc's ultraviolet output, so extraction that pulls the fume cloud sideways away from the arc can increase ozone formation rather than reduce it. On-gun extraction is what HSE recommends for MIG. This is the kind of finding that only turns up when someone measures during the work rather than after it.
Ozone Generation and Treatment Systems
Some workplaces make ozone on purpose. Water and wastewater plants use it for disinfection, and generated ozone leaks.
Continuous detection in generator rooms is a code requirement, not a best practice. Model fire code language, as adopted in section 6005.3.2 of the New York City Fire Code (opens in a new tab), requires ozone gas generator rooms to be mechanically ventilated and "equipped with a continuous gas detection system which will shut off the generator and sound a local audible and visible alarm when concentrations above the permissible exposure limit occur." Note where the alarm threshold comes from: the PEL, which puts it at 0.1 ppm.
EPA's 1999 wastewater technology fact sheet (opens in a new tab) remains its published operational guidance, and it does not hedge. Off-gases must be destroyed before release. "A very small leak can cause unacceptable ambient ozone concentrations." Operators must check routinely, and the monitoring equipment itself must be kept in calibration.
Food processing is the quieter version of the same story. Ozone is an approved antimicrobial under 21 CFR 173.368 (opens in a new tab), used in treating and storing foods including meat and poultry. A NIOSH field investigation of raw beef treatment recorded 5 ppm at the tumbler inlet where workers loaded product, a concentration equal to the IDLH, with general area levels between 0.1 and 1 ppm.
Ozone-Generating Air Cleaners
Facility teams inherit ozone more often than they generate it. Ion generators and other electronic air cleaners produce it through corona discharge, the same physics as an industrial electrostatic precipitator, and some devices are sold to produce it deliberately.
EPA's assessment of that second category is not ambiguous: "at concentrations that do not exceed public health standards, ozone has little potential to remove indoor air contaminants," and the concentration "would have to greatly exceed health standards to be effective."
California acted on this. Since 2010, indoor air cleaners sold in or shipped to the state must be certified under CARB's regulation (opens in a new tab), which caps ozone emissions below 0.050 ppm and covers ionizers, electrostatic precipitators, photocatalytic oxidation devices, UV devices, and corona discharge generators.
One belief is worth retiring while we are here. Photocopiers were a real ozone source in the corona-wire era, and OSHA still described them that way in 1988 (opens in a new tab). Germany's Institute for Occupational Safety and Health now states that for devices meeting the relevant test standard, "ozone is released only in extremely small quantities" (opens in a new tab), and notes that ozone-free printing technology exists. Modern photocopiers are no longer a meaningful ozone source, though older corona-wire machines can be.
Why an Eight-Hour Average Can Miss an Ozone Problem
What the Measurements Show
The 2005 NIOSH evaluation described above measured short-term welding ozone exposures up to 0.7 ppm, seven times the NIOSH ceiling. A follow-up survey at the same facility found full-shift ozone below 0.08 ppm and short-term results at non-detect, but no MIG welding took place during that second survey. The averages looked fine because the exposure was not happening.
A 2019 study in Air Quality, Atmosphere and Health (opens in a new tab) examined this discrepancy directly for gas metal arc welding (GMAW) on aluminum alloys. Short-duration detector tube samples exceeded 0.24 ppm in some cases and 0.40 ppm in others, three to five times the ACGIH light-work value. Long-duration colorimetric badge sampling on the same work returned almost all results at or below 0.01 ppm averaged over eight hours. The authors' framing is that arc welding "superimposes multiple episodes of intense emission of short duration onto the background level during the work shift."
The NIOSH food processing investigation showed the same pattern from a different industry: 5 ppm peaks at the tumbler, and an 8-hour TWA of 0.05 ppm, below the OSHA PEL.
Three studies, three industries, one shape. Ozone exposure in these settings is not a steady background that a shift sample can characterize. It arrives in bursts tied to a task, and the task occupies a small fraction of the shift. Divide a handful of intense minutes across four hundred and eighty of them and the arithmetic does what arithmetic does.
Nothing about that makes the average incorrect. It is a faithful summary of the whole shift. It simply answers a question about the shift rather than a question about the exposure, and those are not the same question. A compliant eight-hour average and a serious ozone exposure can describe the same shift.
Why a Short Exposure Matters
Controlled human exposure studies at one and two hours show effects large enough to matter, and they show wide variation between individuals.
Work funded by the California Air Resources Board (opens in a new tab) exposed trained distance runners for one hour during continuous heavy exercise. At 0.20 ppm, mean FEV1 fell 4.0 to 5.7 percent. At 0.35 ppm, it fell 20.7 to 23.6 percent. EPA's ozone staff paper (opens in a new tab) summarizes a study of 60 healthy subjects exposed to 0.25 ppm for one hour with continuous exercise, in which individual FEV1 responses ranged from a slight increase to a 56 percent decrement, with roughly a third of subjects exceeding a 15 percent decrement. Group means conceal that spread, and so does a shift average.
Two further findings bear directly on how ozone data should be read. Inflammatory response does not resolve when the exposure ends: EPA states that acute ozone exposure "initiates an inflammatory response which may persist for at least 18 to 24 hr post exposure." And repeated daily exposure attenuates the lung function and symptom response without removing the underlying injury. EPA's summary (opens in a new tab) is that attenuation occurs for "acute, neurally-mediated effects (e.g., lung function changes and symptoms)," while "airway injury, inflammation, and repair continue to occur during repeated exposure." Workers stop noticing before the exposure stops mattering, which is a reason not to rely on symptom reporting as a monitoring signal.
The evidence is not uniformly one-directional, and it is worth being precise about that. Studies comparing a steady concentration against a varying one at the same eight-hour mean have found a greater effect from the varying profile at moderate concentrations, but no meaningful difference at low ones. The defensible conclusion is narrower than "peaks are worse than averages": response depends jointly on concentration, breathing rate, and duration, which is why an eight-hour mean on its own is not a sufficient description of an ozone exposure.
What the Limits Themselves Require
The strongest argument here is not toxicological at all. It is procedural.
A ceiling limit cannot be assessed with a full-shift sample, and NIOSH says so in its own guidance. The Occupational Exposure Sampling Strategy Manual (opens in a new tab) defines a ceiling standard as "the maximum concentration that should not be exceeded at any time during the workshift," and states that evaluating one requires "instantaneous or very short term samples that represent the exposure at a particular point in time." OSHA's Technical Manual (opens in a new tab) agrees, directing that where instantaneous monitoring is not feasible, a ceiling be measured over a period of up to 15 minutes.
Meanwhile federal OSHA, having lost the ozone STEL in 1992, has no short-term ozone limit at all.
That is the gap. The enforceable federal limit is an average, the recommended limit is a ceiling, and a shift sample can only evaluate one of them. The same tension runs through PM2.5 exposure limits and monitoring, but it is sharper for ozone, because ozone exposures are so short.
Measuring Ozone: Reference Methods and Sensor Limits
Ozone's Federal Reference Method is a chemiluminescence method, defined in 40 CFR part 50, Appendix D (opens in a new tab), based on the reaction of ozone in sampled air with ethylene or nitric oxide. The calibration standard underlying it is UV photometric, assayed at 254 nm and traceable to a NIST standard reference photometer. In practice, regulatory ambient ozone analyzers are UV photometric instruments designated as Federal Equivalent Methods. EPA also revised the ozone absorption cross-section (opens in a new tab) used in reference calibration, with the new value becoming the only permitted one from January 2026.
Below that tier, the question worth asking of any ozone instrument is what its sensor is actually responding to.
Electrochemical ozone sensors of the oxidizing-gas type respond to ozone and nitrogen dioxide together, and this is a property of the chemistry rather than a defect in any one product. Zuidema and colleagues, writing in the Journal of Occupational and Environmental Hygiene (opens in a new tab) in 2019, put it plainly: "Typical low-cost electrochemical sensors for ozone (O3) are also highly responsive to nitrogen dioxide (NO2)." The established solution is to pair the oxidizing-gas sensor with a second sensor that filters ozone out and reports NO2 alone, then subtract. That is the method described in their paper and in a 2021 evaluation in Sensors (opens in a new tab), and it is standard practice in field deployments.
The practical consequence is a configuration decision rather than a reason to avoid the technology. An oxidizing-gas sensor deployed alone reports total oxidant, and in an environment carrying meaningful NO2 it will read high relative to true ozone. Paired with an NO2 channel, it reports ozone. EPA builds the same concern into its own protocol: its performance testing targets for ozone sensors (opens in a new tab) include NO2 at 100 ppbv in the interferent battery.
Temperature, humidity, and calibration interval are the other three variables, and published field evaluations (opens in a new tab) quantify all of them. The operational takeaway is that ozone sensing is calibration-dependent work: correcting for temperature and humidity measurably improves precision, and a defensible program treats recalibration as scheduled maintenance rather than an exception.
EPA's base performance targets for ozone sensors, computed on 1-hour averages, are a precision standard deviation at or below 5 ppb, a bias slope of 1.0 plus or minus 0.2, an intercept between minus 5 and 5 ppb, linearity R² at or above 0.80, and RMSE at or below 5 ppb. EPA is explicit that these targets apply to non-regulatory supplemental and informational monitoring, and that air sensors do not meet regulatory monitoring requirements under the Clean Air Act.
Key Takeaways
- The OSHA PEL for ozone is 0.1 ppm as an 8-hour TWA, in both general industry and construction. There is no current federal STEL.
- NIOSH sets the same number as a ceiling, and ACGIH scales its limit down to 0.05 ppm for heavy work. The form of the limit matters as much as its value.
- The ambient standard is 70 ppb, lower than the workplace limit, and EPA documents respiratory effects in exercising adults and outdoor workers at 60 to 70 ppb.
- Ozone is destroyed near fresh NO emissions and forms downwind, so monitor siting drives the result more than for any other common parameter.
- Controlled exposures of one hour at 0.25 to 0.35 ppm produce large and highly variable lung function decrements, and inflammation can persist 18 to 24 hours after exposure ends.
- A ceiling limit cannot be evaluated from a full-shift sample. NIOSH's own sampling guidance calls for instantaneous or very short term measurement.
- Oxidizing-gas ozone sensors measure ozone and NO2 together. Pairing them with an NO2 channel is what turns a total oxidant reading into an ozone reading.
How Aethair PRO Supports Ozone Monitoring
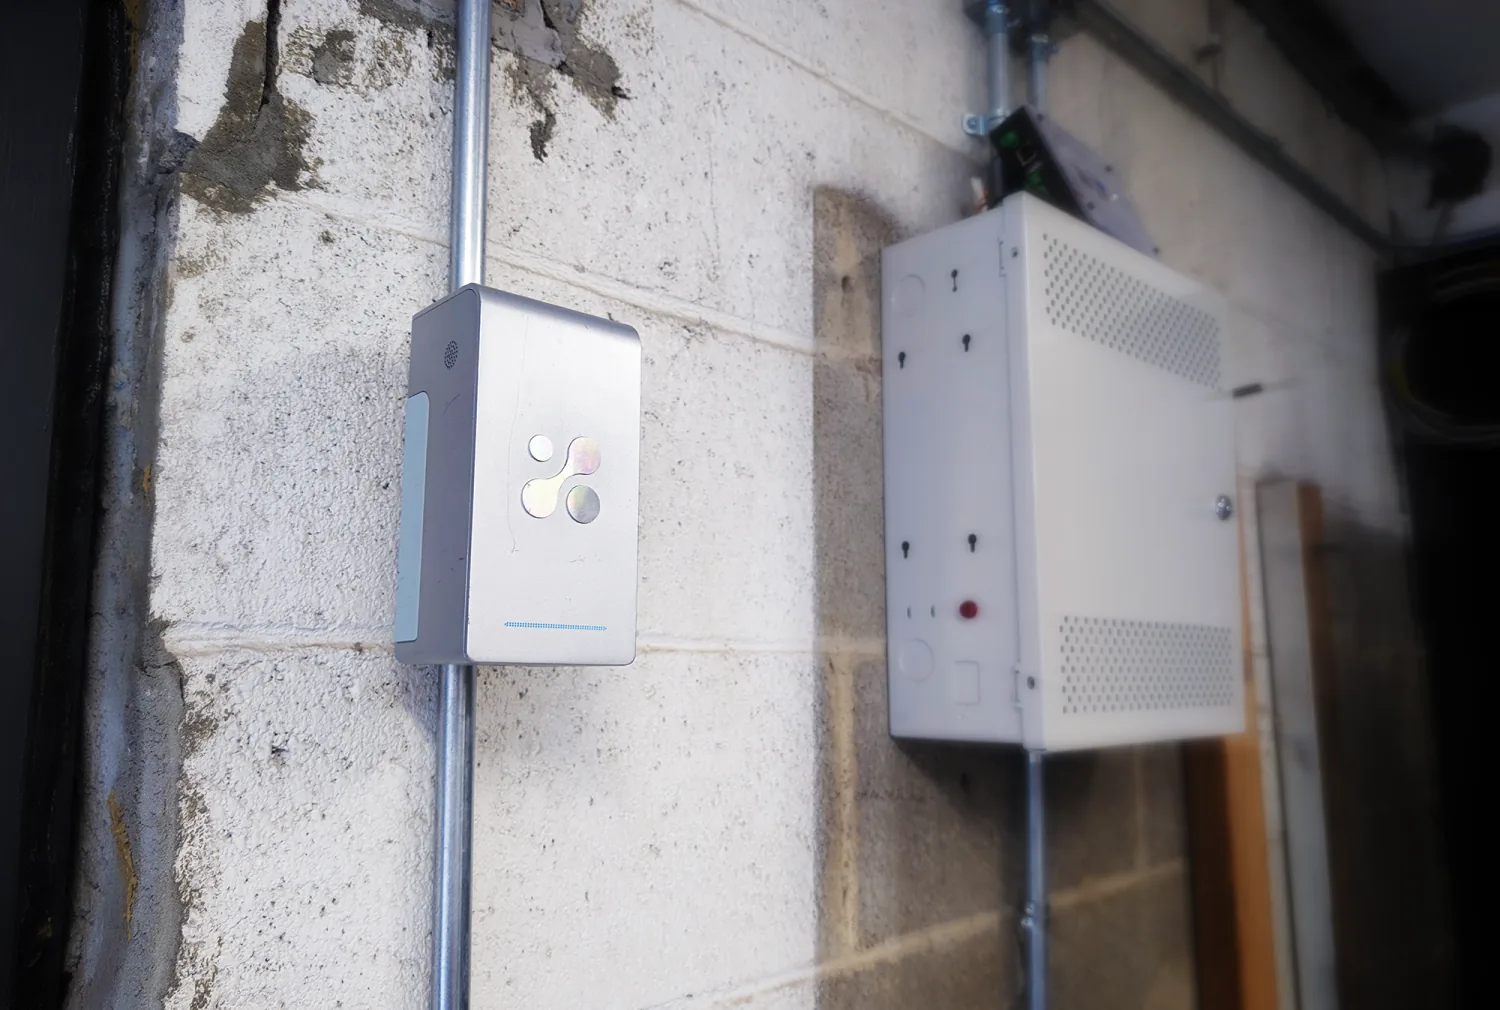
Aethair PRO takes two swappable, pre-calibrated gas sensor cartridges. Ozone is one of the options, alongside NO2, SOx, CO, CO₂, VOCs, methane, and formaldehyde.
For ozone specifically, the configuration matters as much as the device. In any environment with traffic, combustion, or engine exhaust, pair the ozone cartridge with NO2 in the second slot. As explained above, that pairing is what separates ozone from total oxidant. Continuous PM1, PM2.5, and PM10 run alongside the gas channels regardless, with temperature, pressure, and humidity supplying the context that ozone interpretation depends on.
Then there is the matter of where the unit goes. Ozone siting is driven by wind direction and distance from NO sources, which often means positions with no power and no network. Every Aethair PRO has 4G LTE built in, and an optional solar module covers the off-grid case, so a monitor sited 250 meters downwind of a roadway does not need site IT or a shared gateway to report. Where a site already runs reference-grade analyzers or other field instruments, Thiamis brings them onto the same platform.
Data lands in Environet, where short-interval readings are retained rather than collapsed into shift averages and threshold alerts can be set against a ceiling instead of an average. Aethair Reports compiles the record with the data lineage an auditor can follow, and Noesis handles the question that actually gets asked after an incident: when did ozone peak, and what else was running at the time?
The recommended configuration for this
Recommended
best match-

Industrial monitor for indoor and outdoor sites. Built-in sensors cover the essentials, and hot-swappable gas sensor cartridges and a differential-pressure option add more.
Gas 1

Aethair O₃+NO₂
Nitrogen Dioxide (NO₂)Ozone (O₃)Four-electrode electrochemical sensing measures oxidizing gases (ozone plus nitrogen dioxide) and reports one…
Gas 2
Free: one more gas sensor cartridge
MultiSense
Free: a MultiSense, stock or built to order
Expansion
Free: differential pressure
Also measures 13 more
Dew PointHeat IndexRelative HumidityIlluminance / LightParticle Count (by size)PM1PM10PM2.5Total PM / Mass Conc.Barometric PressureEquivalent Continuous Level (Leq)Sound Pressure Level (SPL)Air Temperature
Monitor Ozone Where It Actually Peaks
Aethair PRO carries a swappable ozone sensor cartridge alongside continuous PM1, PM2.5, and PM10 measurement, with 4G LTE on every unit and calibrated data streaming into Environet.
Schedule a Demo (opens in a new tab)See Aethair PRO →Outdoor Monitoring →
Ozone Exposure Limits and Monitoring: FAQs
What is the OSHA permissible exposure limit for ozone?
The OSHA permissible exposure limit for ozone is 0.1 ppm, equivalent to 0.2 mg/m³, as an 8-hour time-weighted average. It appears in Table Z-1 of 29 CFR 1910.1000 for general industry and at the same value in Table 1 to 29 CFR 1926.55 for construction. There is no current federal short-term exposure limit for ozone. A 0.3 ppm STEL was set in OSHA's 1989 Air Contaminants rule, but that rule was vacated in 1992 and OSHA reverted to the earlier limits.
Is the ozone PEL a ceiling or an average?
The OSHA PEL is an 8-hour average, not a ceiling. Ozone's Table Z-1 entry is not preceded by a "C", so the 8-hour time-weighted average applies. NIOSH takes a different approach and sets its recommended exposure limit at the same number as a ceiling, C 0.1 ppm, meaning it should not be exceeded at any point. ACGIH sets lower threshold limit values that vary with workload, down to 0.05 ppm for heavy work.
What is the EPA ozone standard?
The National Ambient Air Quality Standard for ozone is 0.070 ppm, or 70 parts per billion, set in 2015 and codified at 40 CFR 50.19. Attainment is assessed as the annual fourth-highest daily maximum 8-hour average concentration, averaged over three consecutive years. This is an ambient air standard for outdoor air, not a workplace exposure limit, and it is roughly 30 percent lower than the OSHA PEL.
Why does ozone read lower near roads and generators?
Ozone reacts readily with nitric oxide, so fresh combustion emissions destroy it. Concentrations are often suppressed near roadways, engine exhaust, and combustion stacks, then rise downwind as the reaction products go on to form ozone. EPA's siting rules in 40 CFR part 58, Appendix E require ozone probes to be set back from roadways for this reason, from 10 meters at low traffic volumes to 250 meters above 110,000 vehicles per day.
Can a low-cost sensor measure ozone accurately?
Electrochemical ozone sensors of the oxidizing-gas type respond to both ozone and nitrogen dioxide, so a single sensor reports total oxidant rather than ozone. Pairing it with a filtered NO2 sensor and subtracting is the established method, and it is what separates an ozone reading from an oxidant reading. Sensor accuracy also depends on correcting for temperature and humidity and on keeping to a calibration schedule, both of which are well documented in the published field evaluations. EPA publishes performance targets for ozone sensors used in non-regulatory supplemental monitoring, and includes NO2 in its interferent testing battery.