
What Perimeter Air Quality Monitoring Means for Your Project
- May 5, 2026
- · 17 min read
- · Aethair Team
Perimeter air quality monitoring sits at the boundary between operational control and community accountability. For construction sites near occupied buildings, industrial facilities adjacent to residential neighborhoods, and remediation projects on regulated land, the question is no longer whether on-site activity is creating air quality impacts, but whether those impacts are being measured, documented, and reported in a way that holds up to regulator review and community scrutiny. State and federal programs increasingly require a continuous record at the property line, not a periodic sample, and consent decrees and environmental justice initiatives are pushing fenceline transparency into projects that historically operated without it.
For EHS managers, project superintendents, and environmental consultants designing or operating these programs, the practical questions are what perimeter monitoring actually requires, which regulatory frameworks apply to a given project, what parameters and methods are appropriate, and how the resulting data becomes defensible documentation. This article covers the regulatory landscape, the technical components of a fenceline network, and where continuous monitoring fits into the audit trail.
What Is Perimeter Air Quality Monitoring?
Perimeter air quality monitoring, often called fenceline monitoring, is the continuous or near-continuous measurement of air pollutants at the boundary of an active operation, intended to characterize emissions leaving the property and reaching nearby receptors. It is distinct from on-site personal exposure monitoring, which measures what individual workers breathe, and from ambient air quality monitoring, which characterizes regional background conditions across longer timescales. Fenceline monitoring is the bridge between the two: it records the impact of a specific facility or project on the air immediately downwind.
The parameters monitored at a perimeter depend on the source. Construction perimeter monitoring typically focuses on particulates, with PM10 and total suspended particulates (TSP) as the primary indicators of dust migration at construction and demolition sites. Industrial perimeter monitoring, including at refineries and chemical plants, emphasizes speciated gases, with benzene, hydrogen sulfide, sulfur dioxide, and volatile organic compounds (VOCs) as the most common targets. Remediation sites, including brownfield redevelopment and contaminated soil excavation, monitor dust along with VOCs and any contaminants of concern identified in the site investigation. Across all three categories, meteorological data, particularly wind speed and direction, is essential context: a PM10 reading at the eastern fenceline means something different when the wind is blowing east at fifteen miles per hour than when it is calm.
The shift toward perimeter monitoring reflects several converging pressures. Regulatory frameworks adopted over the past two decades, including the EPA Refinery Sector Rule (40 CFR 63 Subpart CC) and state-level rules in California (BAAQMD Reg 12-15, SCAQMD Rule 1180) and New York (NYSDEC DER-10 CAMP), now require continuous data in contexts where periodic sampling was once acceptable. EPA’s longstanding Petroleum Refinery Initiative consent decrees have also embedded fenceline monitoring obligations into refinery settlements going back to the early 2000s. And publicly accessible fenceline data, mandated for refineries by EPA and the California air districts and voluntarily adopted on some major projects, has made the information visible to neighbors, journalists, and elected officials in close to real time. Aethair’s perimeter monitoring solution is purpose-built for this combined regulatory and community context.
When Is Perimeter Monitoring Required?
Perimeter monitoring obligations come from a layered set of federal, state, and local sources, and the same project may be subject to more than one. The starting point for any compliance program is identifying which frameworks apply.
At the federal level, the most prescriptive program is the EPA Refinery Sector Rule, which amended 40 CFR Part 63 Subpart CC in 2015 to require fenceline monitoring of benzene at petroleum refineries via passive sampling tubes (EPA Method 325A/B) collected over rolling 14-day periods. The rule sets an action level of 9 micrograms per cubic meter for the annual rolling Δc (the difference between the maximum and minimum perimeter sampler concentrations) and requires public reporting of the data. It established the regulatory template that several state and local programs have since adopted for other pollutants and other industries.
The EPA extended that fenceline template to chemical manufacturers in its 2024 update to the Hazardous Organic NESHAP (HON), which governs the Synthetic Organic Chemical Manufacturing Industry and Group I and II Polymers and Resins. The rule requires affected facilities to monitor six air toxics at the fenceline (benzene, 1,3-butadiene, ethylene oxide, chloroprene, vinyl chloride, and ethylene dichloride) using passive diffusive samplers collected on a rolling basis and analyzed in a laboratory, following the same Method 325-style approach the refinery rule established. It sets annual-average action levels for the key pollutants (0.9 µg/m³ for benzene, 0.3 µg/m³ for 1,3-butadiene, and 0.4 µg/m³ for ethylene dichloride), with facilities that stay below them for two years allowed to reduce sampling frequency. Chloroprene monitoring at neoprene sources began shortly after the rule took effect, and fenceline monitoring for the remaining pollutants phases in for existing sources two years after the effective date, in mid-2026, though the timeline remains the subject of ongoing litigation and exemption requests. Because the HON method is passive sampling with laboratory analysis rather than real-time measurement, continuous sensors do not replace it; their role is early warning and operational context between sampling periods, and where a facility needs speciated real-time gas data, Thiamis can integrate third-party analyzers into the same platform.
State-level programs vary substantially. New York’s Department of Environmental Conservation (NYSDEC) DER-10 Technical Guidance for Site Investigation and Remediation includes a Community Air Monitoring Plan (CAMP) requirement that applies to most active remediation work, and to many construction projects that disturb contaminated soil. The CAMP framework specifies real-time monitoring of particulates and VOCs at the upwind and downwind perimeter of the work zone, with action levels and response procedures defined in advance. California’s air districts, including the Bay Area Air Quality Management District (BAAQMD Regulation 12, Rule 15) and the South Coast AQMD (Rule 1180), have refinery fenceline rules that extend the EPA framework to additional pollutants and shorter averaging periods. Texas, Louisiana, and other Gulf states address fenceline monitoring through facility-specific permits and consent decrees rather than statewide rules.
Local jurisdictions add another layer, particularly for construction. New York City has codified perimeter dust monitoring expectations into Department of Buildings rules and Department of Environmental Protection enforcement practice, often making it a de facto requirement for major projects. Philadelphia’s Department of Public Health Air Management Services dust control regulation (Air Management Regulation II, Section IX), in effect since 2016 and amended in 2019 to cover earthworks, requires permits and community notification for major demolition (buildings over three stories, taller than 40 feet, or larger than 10,000 square feet), all implosion demolitions, and earthworks disturbing more than 5,000 square feet. Compliance is structured differently from the numerical action levels in DER-10 or the EPA Refinery Rule: rather than a concentration threshold at the property line, Philadelphia sets a performance-based standard, requiring that fugitive dust not be visible where it passes the worksite boundary, alongside prescribed work practices including water and suppressant application, dust control fabric on perimeter fencing, on-site speed limits, and wheel-wash systems at vehicle access points. Continuous perimeter monitoring is not specified in the rule, but the traceable, date-stamped record it produces is among the few ways to objectively document compliance with a visibility-based standard during enforcement review. Many other municipalities adopt similar expectations through site plan review, environmental impact assessments, or community benefit agreements negotiated as a condition of project approval.
The major perimeter monitoring frameworks compared at a glance:
| Framework | Jurisdiction | Primary Pollutants | Action Level / Threshold | Averaging Window |
|---|---|---|---|---|
| EPA Refinery Rule (40 CFR 63 Subpart CC) | Federal | Benzene | 9 μg/m³ | Rolling annual |
| EPA HON Rule (2024, SOCMI + Polymers & Resins) | Federal | Benzene, 1,3-butadiene, ethylene oxide, chloroprene, vinyl chloride, ethylene dichloride | 0.9 μg/m³ benzene; compound-specific for others | Rolling annual |
| NYSDEC DER-10 CAMP | New York State | PM10, VOCs | +100 μg/m³ above upwind; 150 μg/m³ sustained | 15 minutes |
| BAAQMD Reg 12 Rule 15 | Bay Area refineries | Benzene, H₂S, SO₂, alkanes, others | Site-specific | 1 hour to annual |
| SCAQMD Rule 1180 | South Coast (LA basin) refineries | Benzene, BTEX, H₂S, SO₂, NH₃, others | Site-specific | 1 hour to annual |
| Local construction / dust control rules (e.g., NYC DOB, Philadelphia AMS) | Municipal | PM10, TSP, dust | Permit triggers + work-practice requirements | Permit-specific |
| Settlement consent decrees | Project-specific | Varies | Negotiated | Negotiated |
Outside any specific rule, perimeter monitoring is increasingly written into voluntary commitments. ESG disclosures, healthy-building certifications for adjacent properties, and community engagement programs often reference continuous air quality data at the property boundary as evidence of operational performance. For projects that do not have a regulatory obligation today, the trajectory across all three layers points toward more measurement, not less.
What Does DER-10 CAMP Require?
For projects in New York State, the Community Air Monitoring Plan under DER-10 is among the most prescriptive perimeter monitoring frameworks in the country, and it serves as a useful reference even for projects that fall outside its direct jurisdiction. The CAMP applies to remediation activities involving contaminated soil and to many construction projects that disturb impacted media. Its provisions are spelled out in DER-10 Appendix 1A.
The framework requires continuous, real-time monitoring of total particulates (PM10) and VOCs at the upwind and downwind perimeter of the active work zone. The monitoring locations are reset each day based on observed wind direction, and a meteorological station is used to confirm wind speed and direction across the work shift.

The CAMP defines specific action levels: a downwind PM10 reading exceeding the upwind reading by more than 100 micrograms per cubic meter over a fifteen-minute average triggers a dust suppression response, and a sustained downwind exceedance of 150 micrograms per cubic meter requires work to stop until controls are restored. VOC action levels are defined similarly, with site-specific thresholds based on the contaminants of concern identified in the remedial investigation.
The framework also defines documentation expectations. Project teams are required to maintain monitoring data and records of action level exceedances and response actions, and to make those records available to NYSDEC on request. In practice, the credibility of a CAMP record tends to rest on three things: that the instruments were calibrated and the calibration documented, that the data was continuous rather than periodic, and that the meteorological context was preserved alongside the pollutant readings. Reconstructed logs assembled after the fact tend to fare worse under close regulator review than continuous records produced in real time.
Even outside New York, the DER-10 CAMP structure (continuous PM and VOC monitoring at upwind and downwind locations, defined action levels, meteorological correlation, and documentation traceability) reflects the direction that regulators across multiple jurisdictions are moving. Projects that build their perimeter program around a CAMP-equivalent design tend to be well-positioned for whatever specific rule ultimately applies.
What Parameters Should a Perimeter Network Measure?
Designing a perimeter network starts with identifying which pollutants are likely to leave the property and which receptors are at risk. The parameter set typically falls into three groups.
Particulates are the dominant concern at construction, demolition, and aggregate-handling sites. PM10 captures the coarser respirable fraction most associated with visible dust and respiratory irritation, while PM2.5 captures the finer fraction tied to long-term health effects and regulated under the National Ambient Air Quality Standards. Total suspended particulates (TSP) is still specified in some older permits and consent decrees and remains relevant for sites generating coarse dust above the PM10 threshold. Optical particle counters and nephelometers provide the continuous data required for fifteen-minute and one-hour averaging windows, with periodic gravimetric reference sampling used to verify accuracy.
Gases matter at industrial sites, refineries, remediation projects involving petroleum or chlorinated solvents, and any operation generating combustion emissions. Benzene is the canonical fenceline pollutant under the EPA Refinery Rule. Hydrogen sulfide is regulated at refineries and oil and gas operations, with low odor thresholds that drive community complaints well below health-based limits. Sulfur dioxide and nitrogen oxides characterize combustion emissions from generators, equipment, and process heaters. Volatile organic compounds, measured as total VOCs by photoionization detector (PID) or speciated by GC-based analyzers, are central to remediation site CAMPs and to any site working with petroleum-impacted media.
Meteorology is not optional. Wind speed and direction determine which fenceline location is downwind at any given moment, and barometric pressure, temperature, and humidity affect both source emissions and sensor performance. A perimeter monitoring program without an on-site meteorological station produces data that cannot be defensibly tied to source contribution. For most project sites, a single met tower at a representative location is sufficient; larger or topographically complex sites may require multiple stations.
A useful starting point for parameter selection by site type:
| Site Type | Particulates | Gases | Meteorology |
|---|---|---|---|
| Urban construction | PM10, PM2.5, TSP | Optional VOCs | Required |
| Demolition / renovation | PM10, TSP | VOCs from solvents and coatings | Required |
| Refinery / petrochemical | PM2.5 | Benzene, H₂S, SO₂, NO₂, total VOCs | Required |
| Brownfield remediation | PM10 | Speciated VOCs (site-specific) | Required |
| Aggregate / mining | PM10, TSP | Optional combustion gases | Required |
| Industrial / manufacturing | PM10, PM2.5 | Site-specific (CO, NO₂, SO₂, VOCs) | Required |
The choice between field-grade and reference-grade instrumentation depends on the regulatory framework and the consequences of a finding. Program-specific reference methods remain the standard for primary compliance demonstrations: gravimetric or beta-attenuation samplers for particulate mass under NAAQS-aligned programs, EPA Method 325A/B passive sorbent sampling for refinery fenceline benzene under 40 CFR 63 Subpart CC, and chemiluminescence for NO₂. Field-grade optical and electrochemical sensors, when properly calibrated and verified, are sufficient for CAMP-style action level monitoring and for the operational visibility that informs response decisions in real time. A well-designed program often combines both: continuous field-grade data for action-level response, with periodic reference sampling for verification. For a side-by-side look at the equipment options, from standalone stations to pelican-case kits to connected sensor networks, see our article on fenceline air quality monitoring equipment and approaches.
How Continuous, Calibrated Data Supports Audit-Ready Reporting
The defensibility of a perimeter monitoring program does not rest on the instruments alone. It rests on the chain of custody between the sensor and the report. Three properties of the data matter most when a regulator, a community group, or a project counsel reviews the record.
First, continuity. Periodic sampling produces a series of disconnected snapshots, and gaps in the record invite the assumption that exceedances occurred during the unmeasured intervals. Continuous data, recorded at intervals appropriate to the applicable averaging window (fifteen minutes for CAMP, hourly or daily for most NAAQS-derived programs, annually for refinery benzene), eliminates that ambiguity. When fifteen-minute action levels are written into a permit or consent decree, fifteen-minute data is what the record needs to show.
Second, calibration traceability. Every data point should be associated with a sensor in a known calibration state. NIST-traceable calibration certificates, periodic span and zero checks, and automated drift correction in the data pipeline all contribute to a record that survives challenge. The most common failure mode in perimeter monitoring is not bad sensors; it is good sensors with no documented calibration history.
Third, contextual integrity. A PM10 reading without a wind direction, or a VOC reading without a temperature and barometric pressure, is data without context. Audit-ready records preserve the meteorology, the sensor status, the calibration record, and any operational events (a watering truck, a stop-work, a wind shift) alongside the pollutant data. When an exceedance is questioned, the answer comes from the joined record, not the pollutant log alone.
These properties also enable proactive operations. Real-time alerts on exceedance thresholds let project teams respond before an excursion becomes an enforcement event, and trend analysis across the project lifecycle supports root-cause investigation when issues recur. For more on translating environmental data into defensible regulatory outputs, see our article on EHS compliance reporting. For background on the specific health and regulatory framework around fine particulates, see our article on PM2.5 monitoring and regulatory standards.
How Aethair PRO and Thiamis Support Perimeter Monitoring
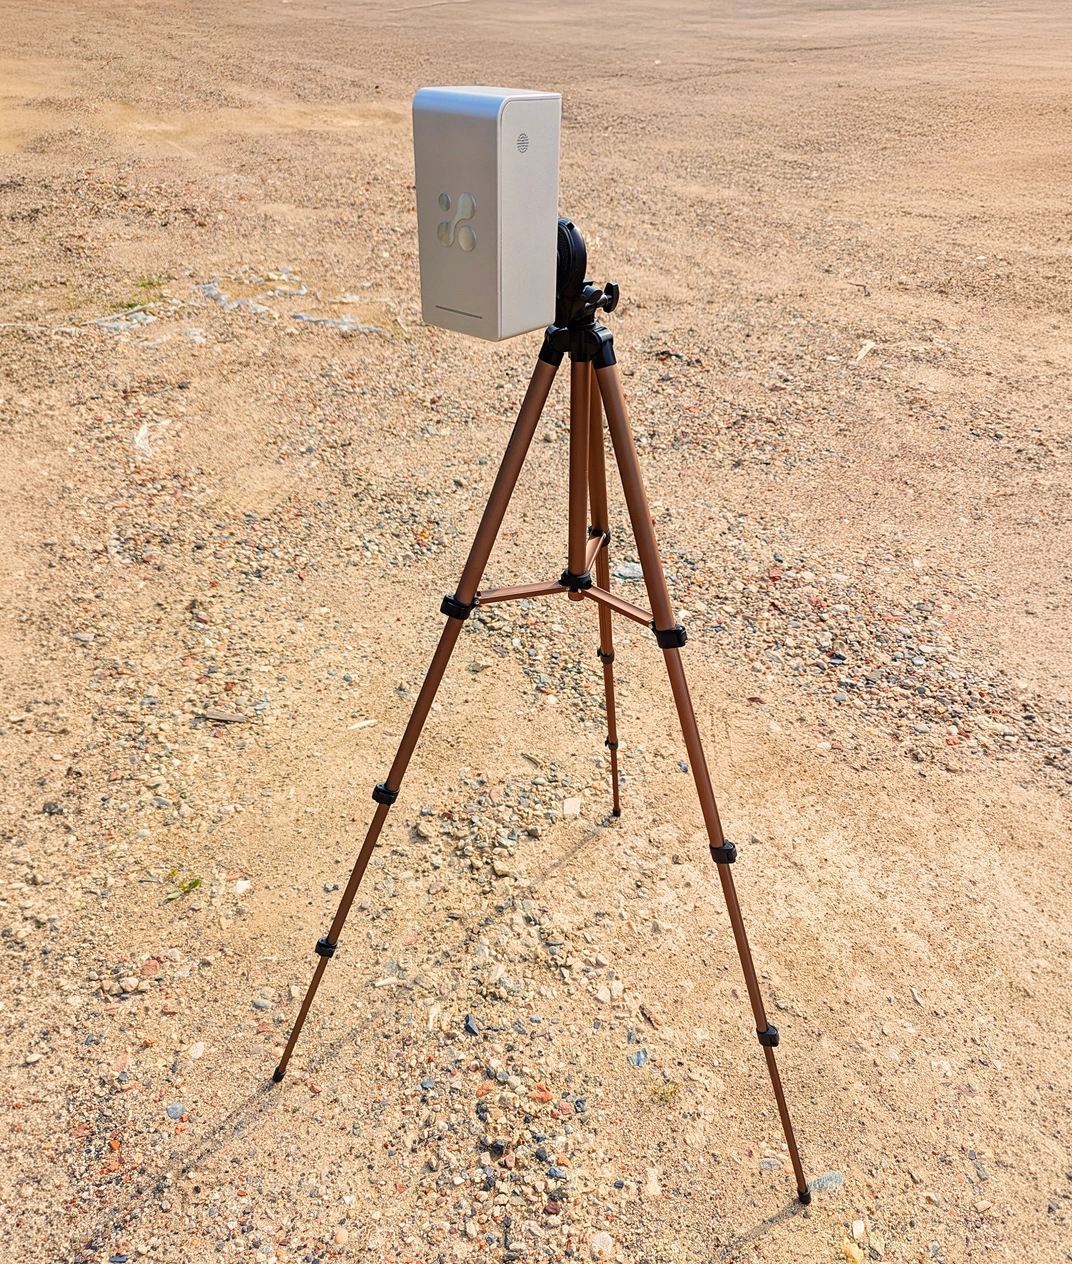
Aethair PRO is an industrial-grade air quality monitoring platform built for fenceline and perimeter deployments. Each unit continuously measures PM1, PM2.5, PM10, and TSP, and can be configured with two gas sensors of your choice. Available options include carbon monoxide, carbon dioxide, nitric oxide, nitrogen dioxide, sulfur dioxide, ozone, hydrogen sulfide, methane, formaldehyde, and total VOCs at ppm or ppb resolution, with additional gases available on request. Each unit also captures temperature, humidity, and barometric pressure (with optional differential pressure, useful for cabin air monitoring and similar applications). Each unit is pre-calibrated for accuracy and reliability and transmits data securely over 4G LTE to Environet, Aethair’s cloud analytics platform, where data can be accessed online.
Thiamis extends a perimeter network by integrating reference-grade instruments, third-party particulate samplers, weather stations, and existing site equipment into the same record. For projects with monitoring infrastructure already in place or with parameters that fall outside Aethair PRO’s native suite, Thiamis brings every reading into one system of record, eliminating the patchwork of separate logs that historically complicated fenceline reporting.
Environet handles the real-time operational layer. It aggregates data at intervals from 5 to 60 minutes (matching CAMP’s 15-minute averaging requirement and NAAQS-aligned hourly windows), flags exceedances against configured action levels as they occur, and routes alerts to project teams by email, SMS, or webhook. Dust suppression, work-stoppage, and wind-shift response decisions happen in the moment rather than after the fact, with every reading preserved in the continuous record.
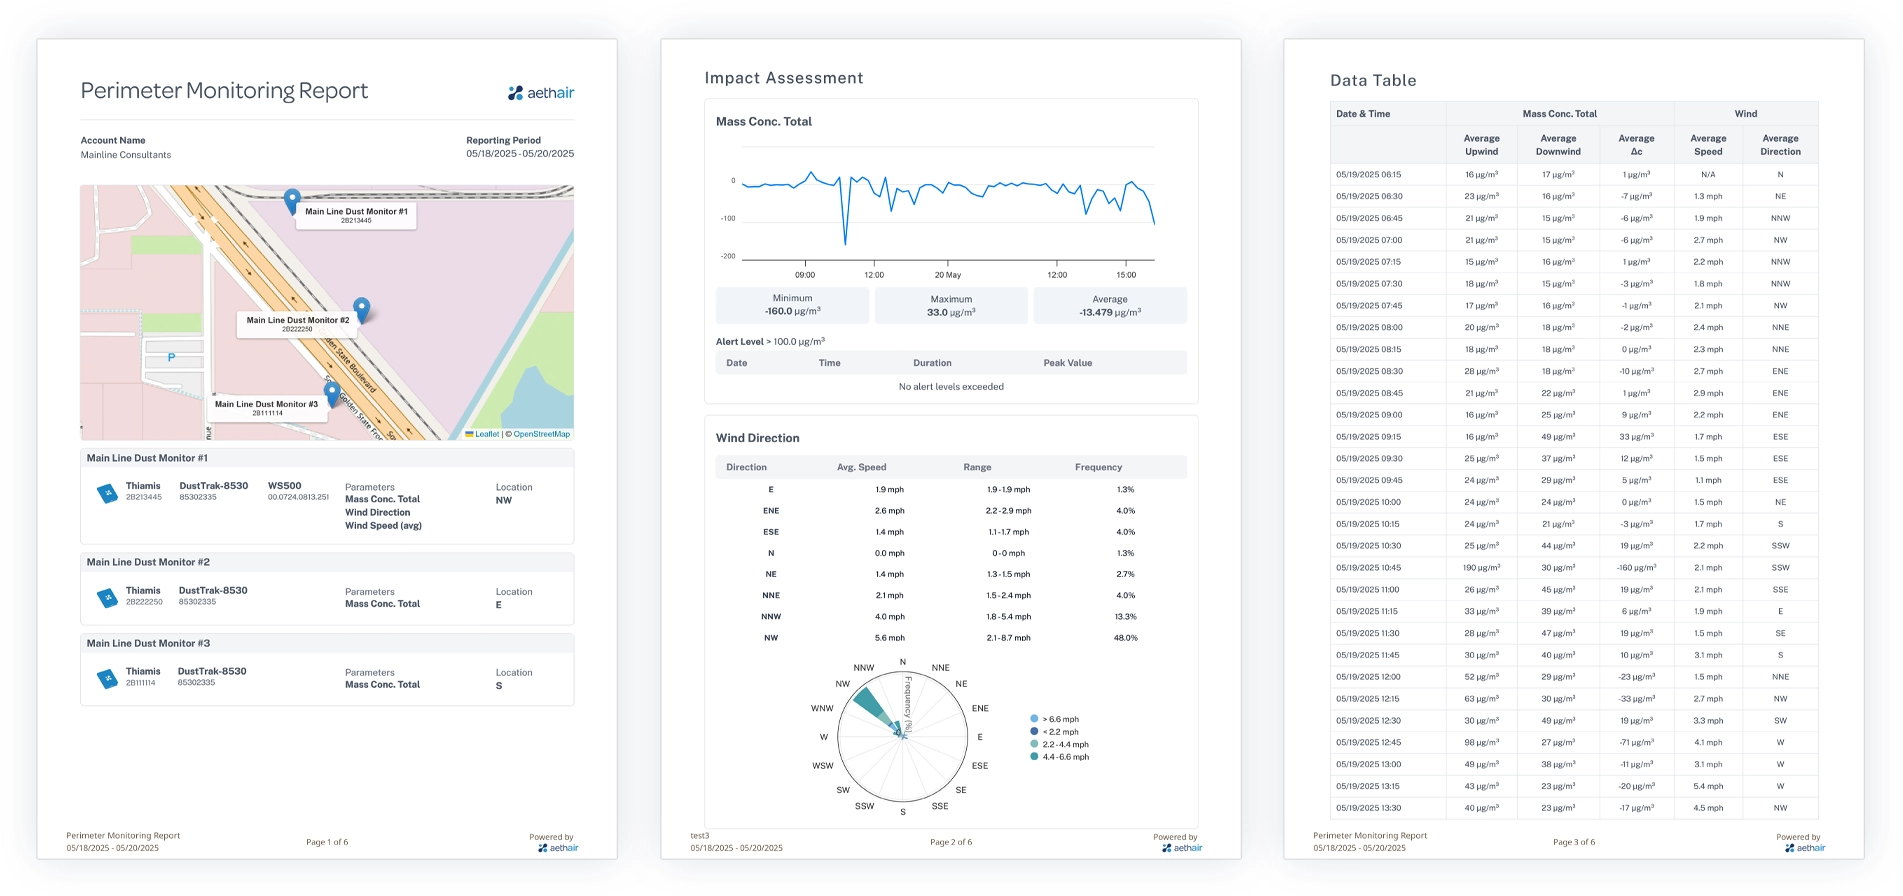
Aethair Reports turn that continuous perimeter data into the structured outputs regulators, project counsel, and community stakeholders actually need. The Perimeter Monitoring report type lets users select their devices and weather stations, designate upwind and downwind locations either manually or by reference to observed wind direction, and configure the parameters and action levels appropriate to the project. The same configuration model serves multiple regulatory contexts: DER-10 CAMP fifteen-minute deltas, EPA Refinery Rule rolling annual benzene Δc, construction dust performance against visibility-based standards like Philadelphia’s, and project-specific consent decree thresholds. Each report renders a project-branded deliverable that includes a site map of monitor placements, an impact assessment with concentration trend graphs and an alert-level event log, a wind direction summary including a wind rose, and a data table with upwind, downwind, and Δc values at the project’s averaging interval. Pollutant readings are joined with meteorological data from any associated weather station within the report, providing the wind context required for defensible interpretation. Reports can be reviewed inside Environet, scheduled for automatic email delivery, shared via web link, or downloaded as PDF for distribution and regulator submission, so the document that lands on a regulator’s desk is the same chain-of-custody record that lived inside Environet, not a re-keyed summary stripped of context.
Noesis, Aethair’s AI analysis engine, layers on top of the same record. EHS teams can query perimeter data in plain language (“show me every fifteen-minute window last week where downwind PM10 exceeded upwind by more than fifty”), surface upwind-downwind correlations across a shift or project phase, and produce narrative summaries without writing them by hand.
Continuous perimeter monitoring does not replace the periodic reference sampling that some programs require for primary compliance demonstrations. It complements that work by providing the continuous, calibrated, contextually complete record that modern fenceline compliance and community accountability depend on.
Perimeter Air Quality Monitoring: FAQs
What is a Community Air Monitoring Plan (CAMP)?
A Community Air Monitoring Plan is a real-time monitoring program required under New York’s NYSDEC DER-10 guidance during site investigation and remediation work. It calls for continuous measurement of particulates and volatile organic compounds at the perimeter of the work zone to protect nearby residents and workers, with defined action levels that trigger a response when exceeded.
What does NYSDEC DER-10 require for perimeter air monitoring?
Under DER-10, issued May 3, 2010, the generic CAMP requires real-time PM-10 and VOC monitoring at the downwind perimeter of the work area. The particulate action level is 150 µg/m³ of PM-10 above upwind background, integrated over 15 minutes, and the VOC action level is 5 ppm above background at the perimeter. Exceedances trigger dust controls, work modifications, or escalation as defined in the plan.
What are EPA fenceline monitoring requirements?
Under the EPA’s 2015 Petroleum Refinery Sector Rule (40 CFR Part 63, Subpart CC), refineries must monitor benzene along their fenceline using passive samplers under EPA Method 325A and 325B, and keep the rolling annual average below an action level of 9 µg/m³. Exceedances require a root cause analysis and corrective action. Refineries have reported fenceline data to the EPA on a quarterly basis since 2019.
What does the EPA HON rule require for fenceline monitoring?
The EPA’s 2024 Hazardous Organic NESHAP (HON) rule requires synthetic organic chemical manufacturing and polymer and resin facilities to monitor six air toxics at the fenceline (benzene, 1,3-butadiene, ethylene oxide, chloroprene, vinyl chloride, and ethylene dichloride) using passive diffusive samplers analyzed in a laboratory, following the Method 325-style approach established by the refinery rule. Annual-average action levels apply, such as 0.9 µg/m³ for benzene, and fenceline monitoring for most pollutants phases in for existing sources in mid-2026. Because the method is passive sampling with lab analysis, continuous sensors complement rather than replace it by providing early warning between sampling periods.
How is construction dust monitored at a site perimeter?
Construction and demolition dust is typically monitored with continuous optical PM-10 and PM2.5 sensors placed at the downwind property line, often paired with weather sensors so readings can be correlated with wind direction. Continuous data provides the date-stamped record that regulators and neighbors expect, and supports action levels like those used in NYSDEC CAMP programs.
For the federal workplace exposure framework that governs on-site activity inside the perimeter, see our article on OSHA air quality standards and PEL compliance. For broader context on building a defensible compliance record from environmental data, see our article on EHS compliance reporting.