
The standard is settled. The map is not. The primary annual National Ambient Air Quality Standard for fine particulate matter has been 9.0 micrograms per cubic meter since May 2024 (opens in a new tab), down from 12.0, and in June 2026 the DC Circuit rejected every challenge to it (opens in a new tab). What does not yet exist is the list of counties that fail it. That list is due by February 6, 2027 under a federal court order. Ambient air quality monitoring is how those determinations get made, and for a facility inside an area that lands on the list, the consequences show up in permitting. A designation does not penalize a site for its own readings. It changes the rules that apply the next time that site wants to build, expand, or renew a permit.
That gap between how the measurement works and where the consequences land is worth closing before the designations arrive. This article covers what ambient monitoring is and how it differs from workplace, indoor, and fenceline programs, where the PM2.5 designations currently stand, what a nonattainment designation actually changes for a site, how attainment is calculated from a three-year design value, and where continuous site-level monitoring fits alongside the regulatory network without pretending to replace it. Every regulatory figure below is cited to the Code of Federal Regulations or to the court record.
Quick answer
Ambient air quality monitoring measures outdoor air at locations meant to represent general public exposure. The regulatory network is run by state, local, and tribal agencies under 40 CFR Part 58 (opens in a new tab) using Federal Reference and Federal Equivalent Methods. Attainment is decided from a design value, which is essentially a three-year average of that monitoring data rather than any single reading. The annual PM2.5 standard is 9.0 µg/m³, and final nonattainment designations are due by February 6, 2027 under a court order. Those decisions rest on the regulatory network. Continuous site-level monitoring answers the question that network was never designed to answer: what is happening at this particular site, right now.
Last reviewed: September 23, 2026. Regulatory citations reflect the Code of Federal Regulations as currently published. Designation status was verified against the EPA's published pages on that date; confirm current status before relying on any date here.
What Ambient Air Quality Monitoring Means
Ambient air quality monitoring is the measurement of outdoor air at a location chosen to represent what the general public breathes, rather than conditions at one source or inside one building. The distinction matters because the word "ambient" carries regulatory weight.
Attainment decisions rest on data sited to represent an area's population exposure, collected with designated methods under a specific quality assurance program. Monitoring sited to characterize one facility answers a different question: what is this operation contributing, when, and under what conditions. Both are real measurements, and a well-run program usually needs both. They are simply not interchangeable inputs, and the difference is about siting and purpose rather than the quality of the instrument.
It helps to place it against the three adjacent categories a facility is more likely to already run. Workplace monitoring measures what employees are exposed to over a shift and is governed by OSHA permissible exposure limits, a separate regime with separate numbers. Indoor monitoring characterizes occupied space and is generally used to verify that ventilation is performing as designed. Perimeter and fenceline monitoring sits at a property boundary and is designed to characterize what is leaving a site, typically with fifteen-minute or rolling-annual windows and action levels written into a permit, a consent decree, or a state program.
Ambient monitoring sits above all three in scale. For fine particulate matter the EPA identifies the neighborhood scale as "the most important spatial scale to effectively characterize the emissions of particulate matter from both mobile and stationary sources," which is a deliberate choice: the standard is about population exposure across an area, not about any individual emitter. A facility can be a meaningful contributor to a regional problem while its own fenceline data looks unremarkable, and the reverse is equally possible.
Where the PM2.5 Designations Stand
The EPA finalized the revised primary annual standard of 9.0 µg/m³ on February 7, 2024, and it took effect on May 6, 2024 (opens in a new tab). The 24-hour standard stayed at 35 µg/m³.
Litigation followed, and it resolved in an unusual way. In Commonwealth of Kentucky v. EPA (opens in a new tab), 179 F.4th 963, decided June 26, 2026, the DC Circuit denied the petitions for review brought by 25 states and a group of industry petitioners. It also denied a motion to vacate the standard filed by the EPA itself. The court held the Administrator had authority to revise the standard outside the ordinary five-year review cycle and restated the long-standing rule that economic considerations play no part in setting an ambient standard. The state and industry petitioners have since asked the Supreme Court to hear the case. An industry petition was filed on August 28, 2026 and docketed as No. 26-298 (opens in a new tab) on September 8, with the government's response, originally due October 8, extended to November 9. A separate petition led by Kentucky and West Virginia is also pending. The Supreme Court has not decided whether to hear either.
The 9.0 µg/m³ standard is in effect.
Designations are the piece that is late. The Clean Air Act required the EPA to designate areas within two years, which set a deadline of February 6, 2026 (opens in a new tab). The agency missed it and was sued in the Northern District of California. On July 17, 2026, in Alliance of Nurses for Healthy Environments v. Zeldin, No. 4:26-cv-03118 (consolidated with No. 4:26-cv-03500), Judge Haywood S. Gilliam Jr. found that the Administrator had failed to perform a nondiscretionary duty and ordered final designations for all areas of the country no later than February 6, 2027.
One further date matters more than February for anyone planning around this. Section 107(d)(1)(B)(ii) of the Act requires the EPA to notify a state at least 120 days before promulgating a designation that modifies what the state recommended. Counting back from February 6, 2027 places that notification in early October 2026. The EPA's own February 2024 designations memorandum (opens in a new tab) used exactly this arithmetic on the original schedule, listing the letters as due "no later than October 9, 2025 (120 days prior to final PM2.5 area designations)."
That is a derivation from the statute and the court order rather than an announced date. As of this writing the EPA has published no proposed or intended designations, no notification letters, and no schedule.
What a Nonattainment Designation Actually Triggers
For a facility, the practical answer is that the permitting rules change, and they change on the effective date of the designation rather than on some later implementation milestone.
| Consequence | What changes | Timing |
|---|---|---|
| State Implementation Plan | The state must submit a Moderate area attainment plan | Within 18 months of the effective date of designation (40 CFR 51.1003(a)(2)) |
| RACM and RACT | Reasonably available control measures and technology implemented in Moderate areas | Within 4 years of the effective date of designation (CAA 189(a)(1)(C), 40 CFR 51.1009(a)(4)(i)(A)) |
| New source review | PSD stops applying to PM2.5. Nonattainment permitting applies instead, under the state's approved program or, until one is approved, the federal interim rules | On the effective date of designation (40 CFR 52.21(a)(2)(i), 52.24(k)) |
| Control technology | Lowest Achievable Emission Rate replaces Best Available Control Technology | With nonattainment NSR (CAA 173(a)(2), 40 CFR 51.165(a)(1)(xiii)) |
| Emission offsets | Increases must be offset by reductions of at least 1:1 unless the area's plan sets a higher ratio | With nonattainment NSR (CAA 173(c), 40 CFR 51.165(a)(9)(i)) |
| Major source threshold | Drops to 70 tpy of PM2.5, or of an individual precursor, in Serious areas | On reclassification to Serious (40 CFR 51.165(a)(1)(iv)(A)) |
| Transportation conformity | Plans and projects must conform to the SIP | Beginning 12 months after the effective date of designation (40 CFR 93.102(d)) |
| Attainment date | Moderate: as late as the end of the sixth calendar year after designation. Serious: the tenth. | 40 CFR 51.1004 |
The shift from Prevention of Significant Deterioration to Nonattainment New Source Review is the one that reshapes project economics. Under PSD, a major source applies Best Available Control Technology, which weighs cost and energy impacts in its analysis. Under nonattainment review, the applicable requirement is the Lowest Achievable Emission Rate (opens in a new tab): the more stringent of the most restrictive limitation in any state implementation plan for that class of source, unless the applicant shows it is not achievable, or the most stringent limitation achieved in practice by that class. It can never be less stringent than an applicable new source performance standard, and unlike Best Available Control Technology it carries no comparable cost consideration. The applicant must also secure offsetting reductions of at least one ton for every ton of increase, certify that its other major sources in the state are in compliance (CAA 173(a)(3)), and analyze alternative sites, sizes, production processes, and control techniques (CAA 173(a)(5)). Offset ratios above 1:1 are common, but they come from individual approved state plans, not a federal PM2.5 ratio. The applicable ratio is a state-level question, and worth answering early because it changes what an expansion costs. On timing, the EPA's own overview of the 2024 standard (opens in a new tab) notes that "the earliest that states would likely need to come into attainment is 2032."
How Attainment Is Actually Measured
Two features of the calculation surprise people who have only worked with real-time data.
The first is that no single measurement determines anything. Attainment is judged on a design value, which for the annual standard is simply a three-year average of the monitoring data. Under 40 CFR Part 50 Appendix N (opens in a new tab), quarterly means are averaged to produce an annual mean, and the annual design value is the arithmetic average of three consecutive annual means, rounded to the nearest tenth of a microgram per cubic meter. The 24-hour design value works on the same three-year principle applied to the 98th percentile of daily values. A bad month does not create a violation, and a good month does not cure one.
The second is data completeness, which has a useful asymmetry built into it. A year meets completeness when all four quarterly capture rates reach at least 75 percent. A year that falls short can still be used to establish a violation, provided there are at least eleven creditable samples in each quarter and the computed value exceeds the standard. It can support a demonstration of attainment only by passing a worst-case test: every missing day in a deficient quarter is filled with the highest value reported for that quarter across the three years, each such quarter needs at least 50 percent capture to try, and the result must still meet the standard.
Incomplete data can convict on its own. It can acquit only under worst-case assumptions.
The network producing those numbers is thinner than most people assume. Minimum monitoring requirements in Part 58 Appendix D (opens in a new tab) scale with population and with how close an area already sits to the standard: three sites for a metropolitan area above one million people where the design value is at or above 85 percent of any PM2.5 NAAQS, two where it is below, one site for an area of 50,000 to 500,000 people near the standard, and none where that smaller area is comfortably under it. Agencies submit an annual network plan by July 1 and reassess the whole network every five years.
None of this is a criticism of the network. It is designed to characterize population exposure across areas efficiently, and it does that. The point for a facility is narrower: a determination that changes your permitting path may rest on a handful of monitors, none of which is measuring your air.
Regulatory Monitoring and Site-Level Monitoring Are Different Jobs
This is the distinction that most often gets blurred in vendor material, and getting it right is what makes a monitoring program defensible.
| Regulatory ambient monitoring | Site-level ambient monitoring | |
|---|---|---|
| Purpose | Determine NAAQS attainment for an area | Characterize air at a specific site, continuously |
| Methods | Federal Reference or Equivalent Methods only | Field-grade continuous instruments |
| Quality assurance | 40 CFR Part 58 Appendix A, collocation, performance evaluation audits | Factory calibration, periodic verification, collocation as designed |
| Operated by | State, local, and tribal agencies | The facility or its consultant |
| Averaging | Three-year design value | Whatever the operational question requires |
| Answers | Is this area in attainment? | What is happening here, right now, and why? |
The limits are worth stating plainly. Field-grade continuous instruments cannot determine attainment or nonattainment, cannot be used to compute a design value, cannot satisfy preconstruction monitoring for a permit application, and cannot serve as a State or Local Air Monitoring Station.
The EPA puts it directly in its guidance on sensor performance: air sensors "will not meet the stringent requirements for air quality instruments used for regulatory purposes, although they may have utility for a variety of non-regulatory applications."
That second clause is the one worth building on. The EPA's term for the category is non-regulatory supplemental and informational monitoring, and the agency has published performance testing protocols and target values for fine particulate sensors (opens in a new tab) precisely because the category is legitimate and worth doing well. The jobs it covers are real ones: characterizing a baseline before a project begins, screening spatial gradients to find out where concentrations actually peak on a property, giving operations a continuous picture with meteorological context, supporting community-facing transparency, and identifying where a reference-grade monitor should go if one is needed.
The Preconstruction Requirement With No PM2.5 Exemption
There is one place where ambient data becomes a direct precondition for a project, and fine particulate matter is treated differently there than anything else.
Under 40 CFR 52.21(m) (opens in a new tab), a PSD applicant must submit an ambient air quality analysis for each pollutant it would emit in significant amounts, and continuous monitoring data supporting it "shall have been gathered over a period of at least one year and shall represent at least the year preceding receipt of the application." The Administrator may accept a shorter period, but not less than four months.
For most pollutants that requirement can be waived where projected impacts fall below a significant monitoring concentration, listed at 40 CFR 52.21(i)(5)(i). Carbon monoxide, nitrogen dioxide, PM10, sulfur dioxide, and lead all have one.
PM2.5 does not. The regulation lists its significant monitoring concentration as zero and adds that, in accordance with Sierra Club v. EPA, 706 F.3d 428 (DC Cir. 2013) (opens in a new tab), no exemption is available with regard to PM2.5. A project with significant PM2.5 emissions cannot make the requirement disappear by modeling a small impact. It can only satisfy it with representative data or a shortened monitoring period.
To be clear about where the line falls: that obligation is met with reference or equivalent method data under the quality assurance requirements of Part 58 Appendix B, and field-grade instruments do not satisfy it. What continuous site-level monitoring does is different and still useful. It tells a project team what conditions at the site look like before they commit to a permitting path, it runs alongside a reference campaign rather than instead of it, and it keeps producing a record after the campaign ends.
How Aethair PRO and Thiamis Support Ambient Monitoring Programs
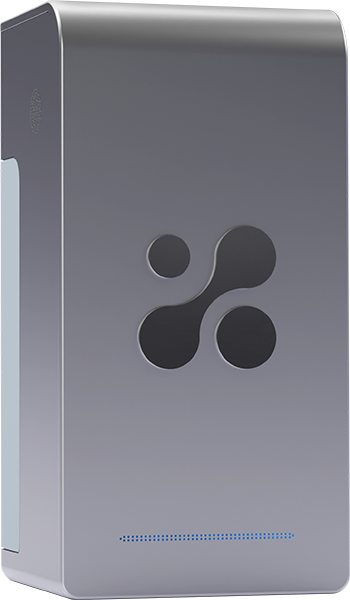
Aethair PRO is built for continuous outdoor deployment. Each unit measures PM1, PM2.5, PM10, and TSP, and takes two hot-swappable gas sensor cartridges chosen from options including carbon monoxide, carbon dioxide, nitric oxide, nitrogen dioxide, sulfur dioxide, ozone, hydrogen sulfide, methane, and total VOCs at ppm or ppb resolution, plus a MultiSense cartridge that adds formaldehyde. For ambient work the criteria pollutants are usually the ones that matter: ozone, nitrogen dioxide, and sulfur dioxide each carry their own national standard, and a site characterizing itself against more than fine particulate needs them measured on the same timeline and in the same record. Each unit also captures temperature, humidity, and barometric pressure, and transmits over 4G LTE to Environet.
That last detail carries more weight outdoors than anywhere else. Ambient and near-boundary monitors sit at property edges, on poles, at the far corner of a site, in positions chosen for what they represent rather than for what infrastructure happens to reach them. Every Aethair unit carries its own cellular connection rather than reporting through a shared gateway, so placement follows the monitoring objective, and a single failed hub cannot take an entire deployment offline.

Thiamis is the piece that matters most for a program running alongside a reference campaign. It brings reference-grade instruments, third-party particulate samplers, weather stations, and equipment already on site into the same record as the Aethair units.
Consider what a permit application actually requires: four months of reference monitoring at minimum, a year more often, running at the same time as whatever continuous monitoring the operations team relies on. Those are two datasets on two timelines in two systems unless something joins them. Thiamis joins them, and it also carries the meteorological data needed to interpret either one.
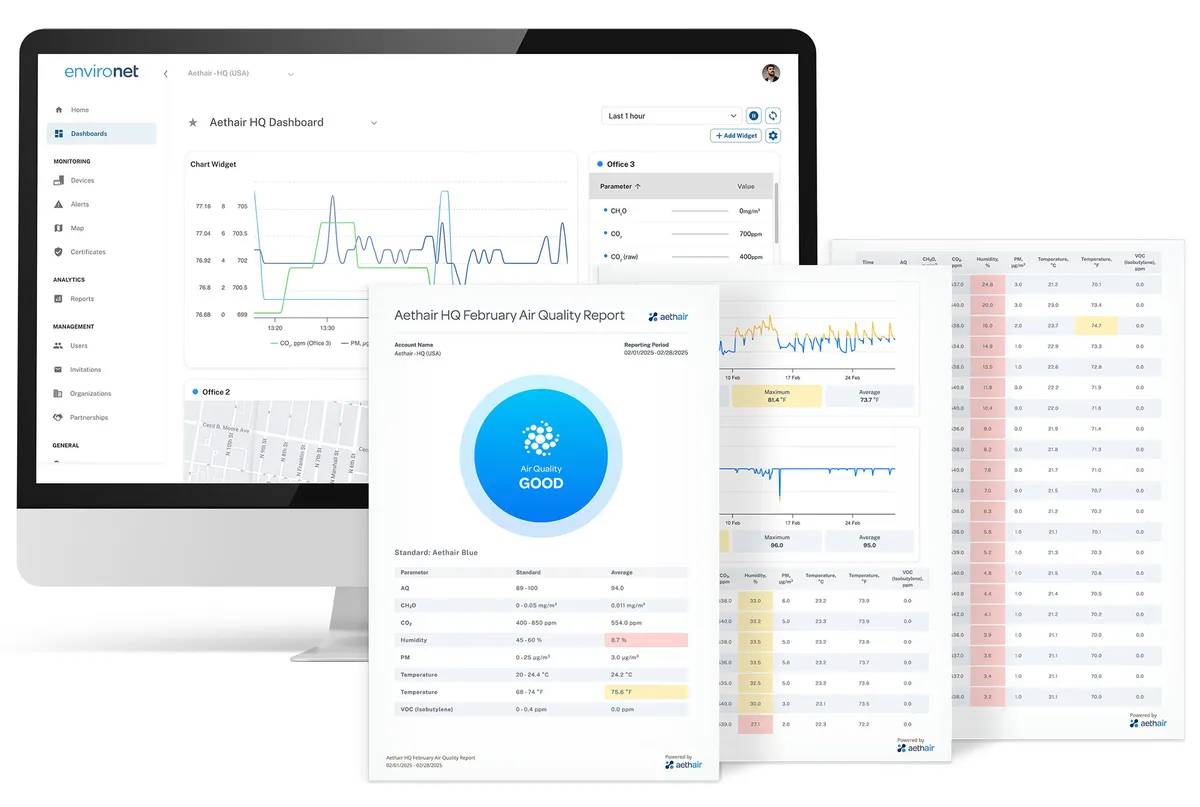
Environet holds that record and runs the operational layer on top of it. Data is aggregated at whatever interval the program calls for, concentrations are flagged against configured thresholds as they occur, and alerts route to the team by email or SMS. Because ambient standards are written around hourly, daily, and annual windows while operational decisions happen in minutes, the same underlying record has to serve both, and it does.
Aethair Reports turns the same record into a deliverable: a document carrying concentration trends, an event log, the meteorological summary, and the underlying data table. Reports can be reviewed inside Environet, scheduled for automatic delivery, shared by secure link, or downloaded as PDF. The document that reaches a regulator, a client, or a community meeting is generated from the stored record rather than reassembled by hand from exports, which is the difference between a report and a summary of one.
Noesis adds the analysis layer to the same data. A team can ask questions in plain language rather than building queries by hand: which 24-hour periods last quarter ran highest, how site concentrations tracked against the nearest regulatory monitor over a season, whether elevated readings cluster by wind direction in a way that points at a particular source. For a facility assembling a picture of its own baseline ahead of a designation, that is the work that would otherwise occupy an analyst for a week.
Every device is calibrated before it ships, and calibration records are available on request, so a site can show its instruments were producing trustworthy data when the readings were taken.
Aethair provides a continuous, calibrated, documented account of conditions at the site itself, with the meteorological context needed to interpret it, during a period when the regulatory picture around that site is about to change.
What Makes Aethair Different: One Record Across Every Step
Working with environmental data involves five distinct jobs: seeing what conditions are, using that view in daily operations, analyzing it when a question comes up, being alerted when something moves, and reporting on all of it when someone asks.
Most programs assemble those from separate tools. A sensor vendor's dashboard covers the first two, a spreadsheet covers the third, an alerting service or a person watching a screen covers the fourth, and the fifth gets built by hand at the end of a quarter. Each of those tools may be good at its job. The difficulty is the space between them, because every handoff is a place the record can break: a manual export that drops a gap, a figure re-keyed into a report, two systems that disagree about what happened on a given afternoon, a calibration certificate that lives somewhere the data does not.
That matters more in ambient work than in most applications, because the questions arrive late. A regulator, a community group, or your own counsel asks what conditions were at a site eighteen months ago, and the answer has to come from a record assembled while nobody was anticipating the question.
Aethair runs all five jobs against the same stored data. Environet is where conditions are seen and worked with day to day. Noesis answers questions asked of that same data in plain language, without exporting it first. Alerting runs off the same thresholds the record already holds. And Aethair Reports produces the finished document from that record rather than from a copy of it, which is what keeps the number in a report and the number in the system the same number.
That last step is where the difference usually becomes obvious. A report assembled by hand is a new artifact, one that has to be checked against the data it came from and re-checked every time it is revised. A report generated from the record is the record, presented. The gaps are visible because they were never smoothed over, the thresholds shown are the ones that were actually in force, and the calibration history behind the instruments is part of the same account.
Seeing, using, analyzing, alerting, reporting: five views of one record rather than five systems passing files between each other. The aim is a platform simple enough to use on an ordinary Tuesday and complete enough to defend at an audit.
The recommended configuration for this
Recommended
best match-

Industrial monitor for indoor and outdoor sites. Built-in sensors cover the essentials, and hot-swappable gas sensor cartridges and a differential-pressure option add more.
Built-inPM2.5Gas 1
Free: one more gas sensor cartridge
Gas 2
Free: one more gas sensor cartridge
MultiSense
Free: a MultiSense, stock or built to order
Expansion
Free: differential pressure
Also measures 12 more
Dew PointHeat IndexRelative HumidityIlluminance / LightParticle Count (by size)PM1PM10Total PM / Mass Conc.Barometric PressureEquivalent Continuous Level (Leq)Sound Pressure Level (SPL)Air Temperature
Not in this configuration 1
Wind Direction
Recommended
best match-

Thiamis connects 1 instrument
A gateway that connects the third-party instruments you choose to the Aethair Platform.
-

Met One Particulate & Dust Monitors
PM2.5Wind DirectionMet One (Acoem) real-time particulate monitors.
Also measures 4 more
Relative HumidityPM10Air TemperatureWind Speed -
Continuous Ambient Monitoring for Your Site
See how Aethair PRO and Thiamis deliver continuous outdoor particulate, gas, and meteorological data, with Environet as the record behind it.
Schedule a call (opens in a new tab)See Outdoor Monitoring →Explore Aethair PRO →
Ambient Air Quality Monitoring: FAQs
What is ambient air quality monitoring?
Ambient air quality monitoring is the measurement of outdoor air at a location intended to represent general public exposure rather than conditions at a single source or inside a building. In the United States it underpins the National Ambient Air Quality Standards, and the regulatory network is operated by state, local, and tribal agencies under 40 CFR Part 58 using Federal Reference Methods and Federal Equivalent Methods. For fine particulate matter, attainment is determined from a three-year design value rather than from any individual measurement.
What is the difference between ambient and fenceline air quality monitoring?
Ambient monitoring characterizes outdoor air across a neighborhood or wider area to represent general public exposure, and it is the basis for attainment decisions under the National Ambient Air Quality Standards. Fenceline and perimeter monitoring measure at the boundary of a specific site to characterize what is leaving that property, usually with much shorter averaging windows and site-specific or permit-specific action levels. They answer different questions and are governed by different rules, so a facility may be subject to both.
What is the current PM2.5 NAAQS?
The primary annual standard for fine particulate matter is 9.0 micrograms per cubic meter, lowered from 12.0 by the EPA's 2024 revision, which took effect on May 6, 2024. The 24-hour standard remains 35 micrograms per cubic meter. Both are ambient outdoor standards evaluated as multi-year design values, not workplace exposure limits and not thresholds for indoor air.
When will EPA designate PM2.5 nonattainment areas?
Designations were statutorily due on February 6, 2026, and the EPA did not meet that deadline. On July 17, 2026, in Alliance of Nurses for Healthy Environments v. Zeldin, the US District Court for the Northern District of California ordered the agency to issue final designations for all areas no later than February 6, 2027. The Clean Air Act separately requires the EPA to notify a state at least 120 days before promulgating a designation that modifies the state's recommendation, which places that notification in early October 2026 if the February date holds. The EPA has not published proposed or intended designations and has announced no schedule of its own.
Can low-cost or field-grade sensors be used for NAAQS compliance?
No. Attainment decisions and design values require Federal Reference Method or Federal Equivalent Method instruments operated under the quality assurance requirements of 40 CFR Part 58 Appendix A. The EPA states directly that air sensors will not meet the requirements for instruments used for regulatory purposes, while noting they have utility for non-regulatory applications. The agency has published performance testing protocols and target values for fine particulate sensors used in what it calls non-regulatory supplemental and informational monitoring, which is where continuous field-grade instruments belong.
How is a PM2.5 design value calculated?
A design value is essentially a three-year average of the monitoring data. For the annual standard, quarterly means are averaged to produce an annual mean, and the design value is the arithmetic average of three consecutive annual means, rounded to the nearest tenth of a microgram per cubic meter. For the 24-hour standard, the 98th percentile of daily values is identified for each year and the design value is the average of three annual 98th percentiles, rounded to the nearest whole number. A year meets completeness requirements when all four quarters capture at least 75 percent of scheduled samples.