
Aethair solutions
Perimeter Air and Fenceline Monitoring
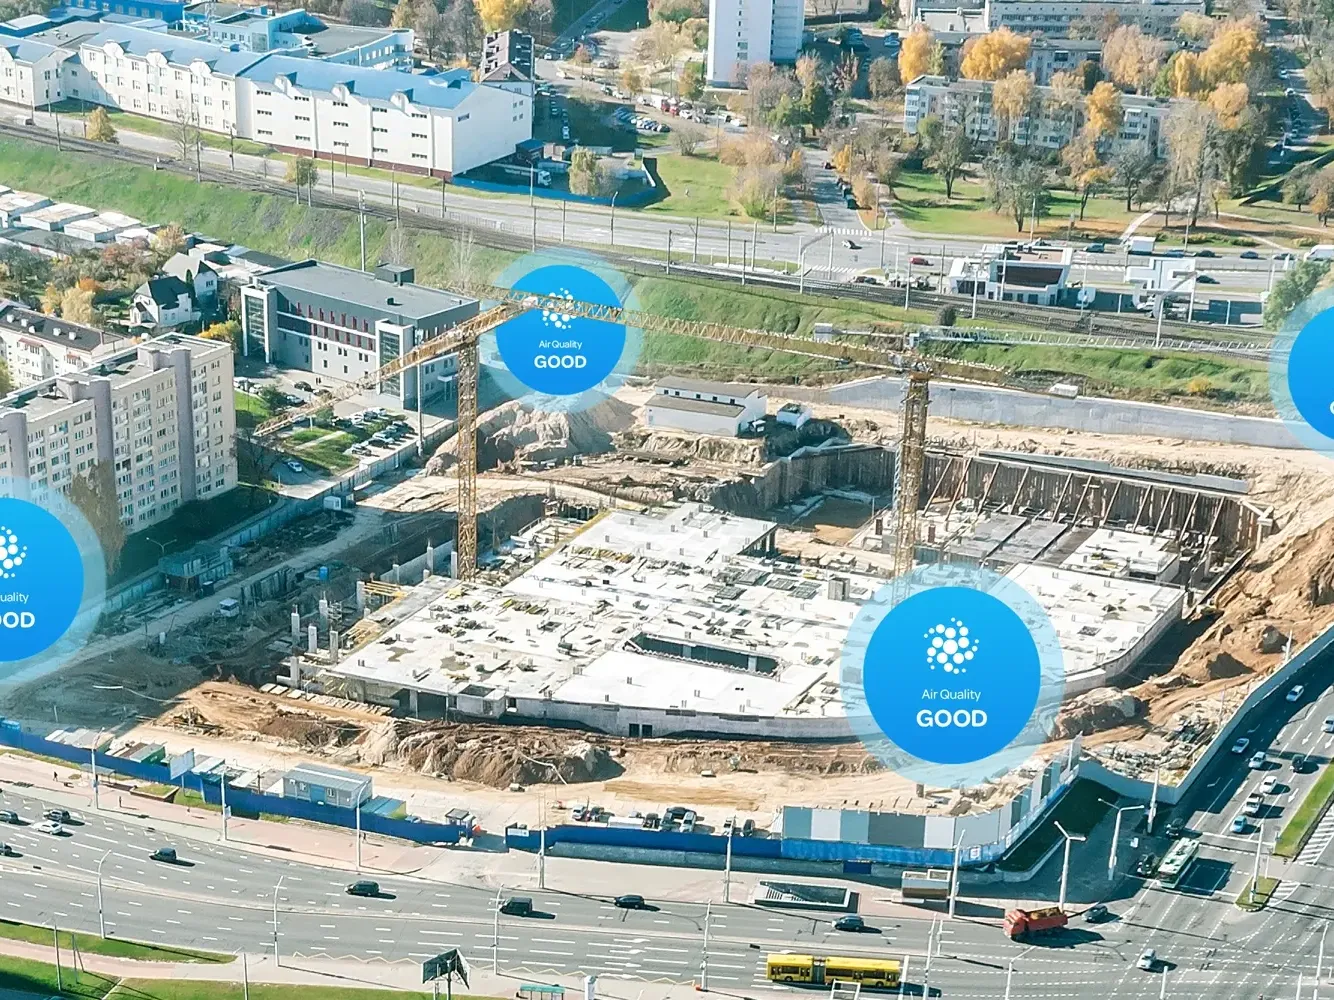
Real-Time Perimeter and Fenceline Monitoring for Construction Sites
Why it matters
Why Construction Sites Monitor the Boundary
Dust, respirable silica, VOCs, and exhaust from an active site carry health, community, and regulatory risk: complaints from neighbors, stop-work orders, and permit conditions that ask for evidence. Continuous monitoring at the boundary turns each of those from an argument into a record.
- Permit and planning conditions: a continuous record at the boundary against the trigger levels in the site's permit, a DER-10 Community Air Monitoring Plan, or a local dust rule.
- Dust control: PM1, PM2.5, PM10, and total PM in real time, so suppression starts before a neighbor calls.
- Fenceline emissions: VOCs and gases from fuel, adhesives, and building materials, seen at the perimeter.
- Lower monitoring cost: owned, connected monitors in place of rented dust kits that someone has to visit and download.
What to measure
The Perimeter Panel and the Limits That Apply
Four numbers appear in most permit conditions, and the rest are added depending on the site. Every limit below is the published value from the standard that sets it.
The core panel is PM10 and PM2.5 for airborne dust, total dust for the broader nuisance fraction, and noise (Leq) for the acoustic limit. Where concrete or stone is cut, respirable crystalline silica adds a worker-health limit of its own, assessed by personal sampling, with perimeter PM data as a supporting indicator. Wind speed and direction from an on-site weather station are essential companions: they show whether a dust exceedance came from on-site work or from a passing truck or a neighboring site, which is often the deciding factor in a dispute. Sites with demolition or heavy equipment may add NO₂ and VOCs from exhaust and fuels.
PM10 is the dust fraction most visibly generated by construction and demolition (cutting, crushing, earthmoving, and vehicle movement), and it is usually the number written into a site's permit conditions. Real-time PM10 monitoring at the boundary, paired with wind data, lets a site apply suppression before it breaches a trigger level and provides the evidence to answer a neighbor's complaint or a regulator's query.
- NYSDEC DER-10 100 µg/m³: dust suppression required (Appendix 1A)
- NYSDEC DER-10 150 µg/m³: work stops if still exceeded after dust suppression (Appendix 1A)
- SCAQMD 1466 25 µg/m³: earth-moving stops or dust controls apply until at or below 25 µg/m³ averaged over 30 minutes
While PM10 dominates construction dust conditions, the finer PM2.5 fraction matters for community health exposure and for demolition, cutting, and combustion sources on site. Monitoring PM2.5 alongside PM10 at the boundary gives a fuller picture of the health-relevant dust reaching neighbors, and separates the fine combustion-and-cutting signal from the coarse mechanical dust.
- EPA NAAQS 9 µg/m³: 2024 primary
Total suspended particulate captures the full dust burden a construction or demolition site generates, from the coarse nuisance dust that settles on neighboring property to the finer health-relevant fractions. Monitoring total PM alongside PM10 and PM2.5 at the boundary gives the broadest measure of the site's dust impact and supports both nuisance-complaint response and permit compliance.
Total PM / Mass Conc.: sensors, units, and every standardConstruction noise, expressed as the equivalent continuous level (Leq), is regulated at the site boundary in most permits because equipment, breakers, and haul trucks carry sound far beyond the site fence. Continuous Leq monitoring against the permitted limit lets a site manage its noisiest activities within agreed hours and thresholds and evidences compliance when residents or regulators ask.
Equivalent Continuous Level (Leq): sensors, units, and every standardRespirable crystalline silica (RCS); a carcinogenic dust fraction with strict occupational exposure limits.
Respirable Crystalline Silica: sensors, units, and every standardRespirable particulate ≤4 µm (respirable convention); the fraction reaching the gas-exchange region, used in occupational dust exposure.
PM4 (Respirable): sensors, units, and every standardMaximum sound level over the interval.
Max Level (Lmax): sensors, units, and every standardStatistical / percentile level (e.g.
Statistical Level (Ln): sensors, units, and every standardHorizontal wind speed.
Wind Speed: sensors, units, and every standardHorizontal wind direction (0–360°).
Wind Direction: sensors, units, and every standardNitrogen dioxide: a criteria pollutant, respiratory irritant, and marker of traffic combustion.
Nitrogen Dioxide (NO₂): sensors, units, and every standardTotal volatile organic compounds: a broadband, PID-based indicator of solvent and fuel vapors.
- NYSDEC DER-10 5 ppm: total organic vapors at the downwind perimeter; work halts until readings drop below (Appendix 1A)
- NYSDEC DER-10 25 ppm: activities shut down; no averaging period stated (Appendix 1A)
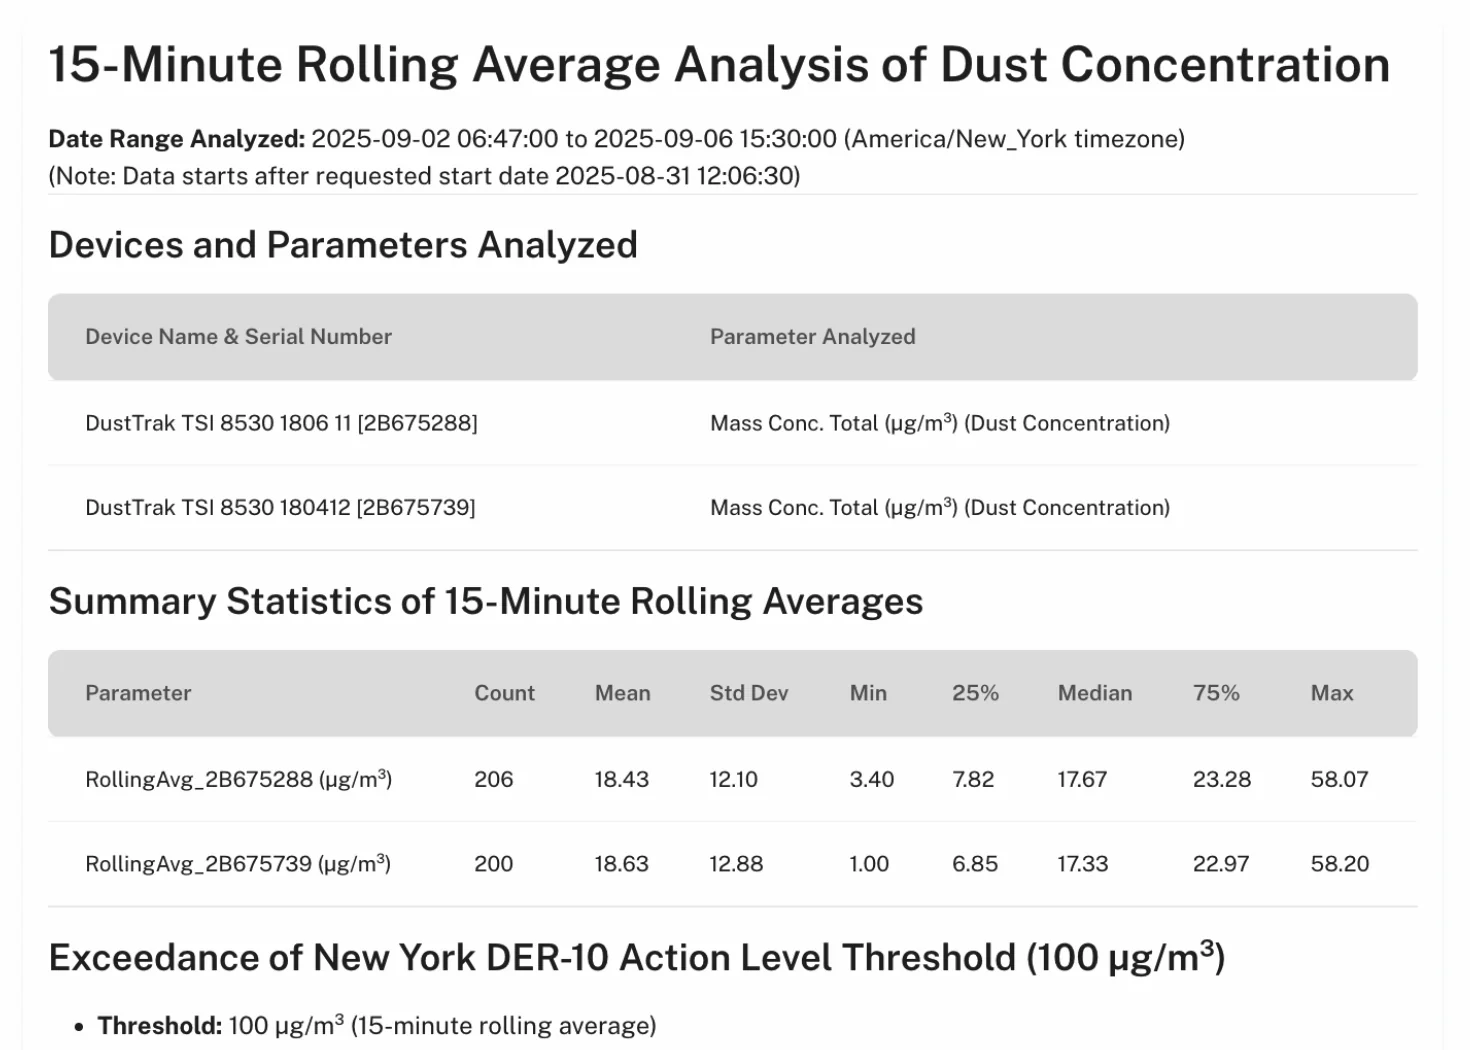
Many site limits are not national standards but action levels written into a plan. The best known is New York's DER-10 Community Air Monitoring Plan: a downwind PM10 reading more than 100 µg/m³ above upwind over 15 minutes calls for dust suppression, work stops if it stays more than 150 µg/m³ above upwind after suppression, and VOCs more than 5 ppm above background halt work. At refineries the EPA's fenceline rule (40 CFR 63 Subpart CC) prescribes passive benzene samplers under EPA Method 325A/B instead. The 2024 HON rule extends fenceline monitoring to chemical plants (in force for existing sources since July 15, 2026) with the same passive tubes for four compounds and canister sampling under EPA Method 327 for ethylene oxide and vinyl chloride. Both are laboratory methods, so continuous monitors add the early warning between samples. The perimeter monitoring guide covers each framework.
The setup
How a Perimeter Monitoring Setup Works
Monitors go on the boundary, concentrated on the sides facing the nearest neighbors, with at least one upwind for comparison.
Instruments are placed along the boundary, concentrated on the sides facing the nearest sensitive receptors, with real-time dust and noise monitors logging continuously and alerting when concentrations approach a locally set trigger level below the hard limit. That margin is what makes the data actionable: water suppression, wheel washing, screening, or a pause in the noisiest work can be applied before an exceedance is recorded. Wind data alongside every reading provides source attribution. For worker silica exposure, gravimetric personal sampling runs in parallel with the real-time dust picture. The recommended configuration below assembles a boundary dust-and-noise station. Use the configurator to add silica, meteorology, or gases as the site demands.
Aethair PRO ships calibrated, runs on grid power or the Solar Panel Bracket, and reports over its own 4G LTE connection, so there is no site network to join. Mount it, power it on, and the readings appear in Environet. From there the data is yours, live and historical, as JSON or CSV through the Environet API. The first configuration below is one boundary station. The second adds an anemometer on Thiamis, so every dust reading carries the wind direction behind it.
Recommended
best match-

Industrial monitor for indoor and outdoor sites. Built-in sensors cover the essentials, and hot-swappable gas sensor cartridges and a differential-pressure option add more.
Built-inPM10PM2.5Total PM / Mass Conc.Equivalent Continuous Level (Leq)Gas 1
Free: one more gas sensor cartridge
Gas 2
Free: one more gas sensor cartridge
MultiSense
Free: a MultiSense, stock or built to order
Expansion
Free: differential pressure
Also measures 9 more
Dew PointHeat IndexRelative HumidityIlluminance / LightParticle Count (by size)PM1Barometric PressureSound Pressure Level (SPL)Air Temperature
Recommended
best match-
Industrial monitor for indoor and outdoor sites. Built-in sensors cover the essentials, and hot-swappable gas sensor cartridges and a differential-pressure option add more.
Built-inPM10PM2.5Total PM / Mass Conc.Equivalent Continuous Level (Leq)Gas 1
Free: one more gas sensor cartridge
Gas 2
Free: one more gas sensor cartridge
MultiSense
Free: a MultiSense, stock or built to order
Expansion
Free: differential pressure
Also measures 9 more
Dew PointHeat IndexRelative HumidityIlluminance / LightParticle Count (by size)PM1Barometric PressureSound Pressure Level (SPL)Air Temperature -

Thiamis connects 1 instrument
A gateway that connects the third-party instruments you choose to the Aethair Platform.
-
 Wind DirectionWind Speed
R.M. Young ResponseONE weather instruments, with solid-state ultrasonic wind sensing and no moving parts.
Swap for
Also measures 3 more
Relative HumidityBarometric PressureAir Temperature -
Which monitor
Perimeter and Fenceline Monitoring Hardware
Aethair PRO is the station on the fence: PM1, PM2.5, PM10, total PM, sound level, temperature, humidity, and pressure built in, gas sensor cartridges for ppb-level VOCs or a specific gas, 4G LTE, and the Solar Panel Bracket where there is no grid power. Its sound level is a continuous boundary trend; where a permit names a Class 1 or Class 2 sound level meter to IEC 61672, that meter joins through Thiamis. Thiamis connects everything else (an anemometer or weather station for wind attribution, a noise meter, a gas analyzer), and an existing perimeter setup keeps running: a TSI DustTrak or another supported instrument connects to Thiamis, and its readings join the same alerts and reports. Both report over cellular, so a site of any size ends up in one account.
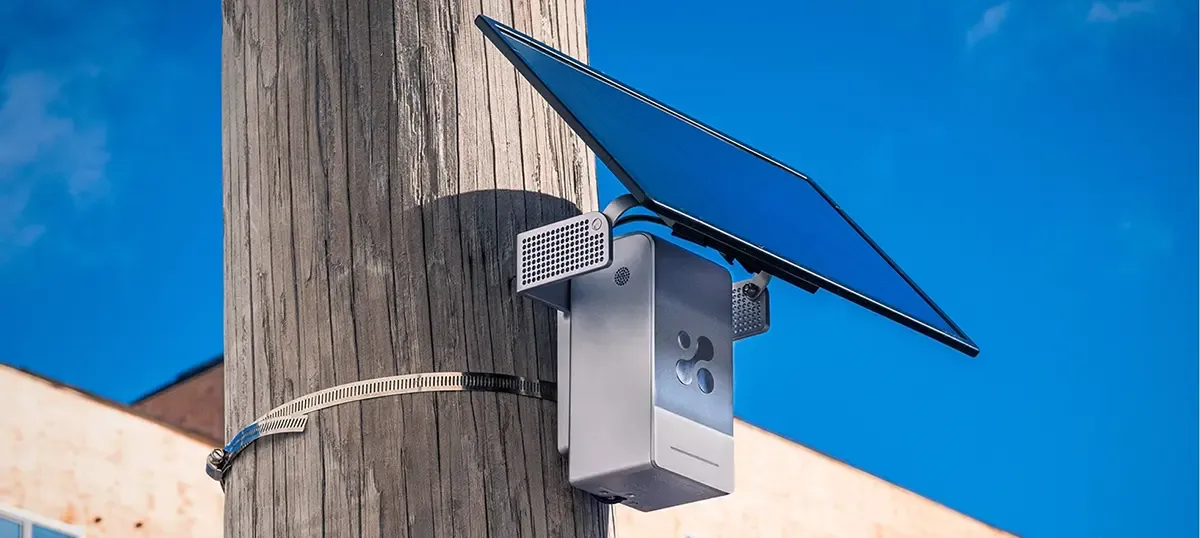
Aethair PRO
Industrial monitor for indoor and outdoor sites. Built-in sensors cover the essentials, and hot-swappable gas sensor cartridges and a differential-pressure option add more.
4 built-in parameters (PM2.5, PM10, noise …), plus 19 swappable cartridges (H₂S, SO₂, NO₂, CO, O₃, CH₄ and more) in 2 gas sockets, 1 MultiSense socket, and 1 expansion socket
See Aethair PRO
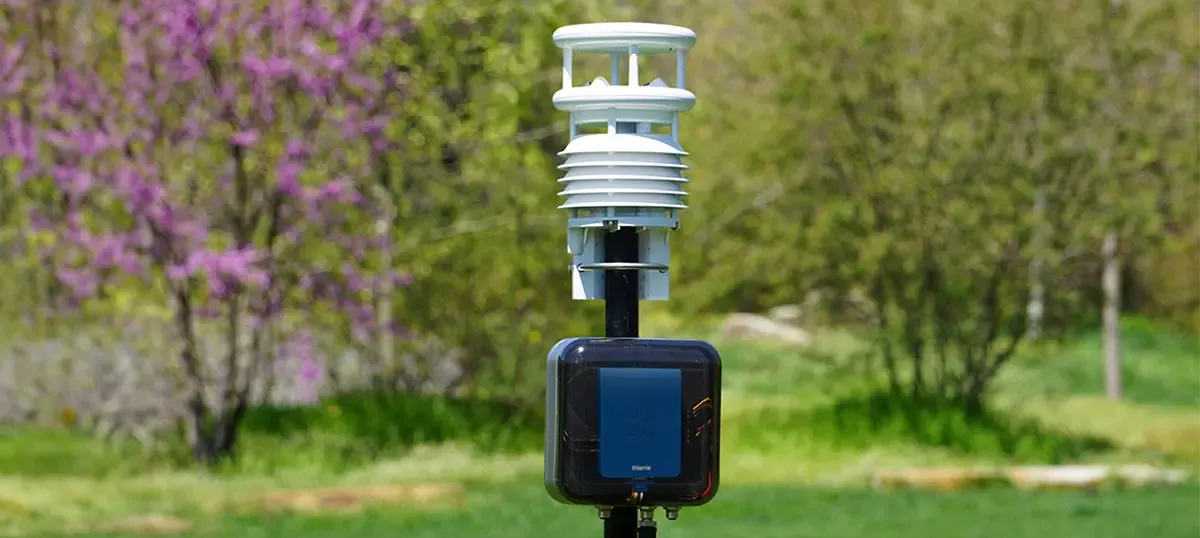
Thiamis
A gateway that connects the third-party instruments you choose to the Aethair Platform.
RS-232, RS-485, SDI-12, and USB · 224 device models from 35 integrations
See Thiamis
What you get
Live Alerts, and a Perimeter Report in Seconds
Every reading lands in Environet, where a trigger level raises an alert by email, SMS, or webhook while there is still time to suppress the dust. Aethair Reports then writes the perimeter report from the same readings, with upwind and downwind monitors and the wind behind every event, on demand or on a schedule. These are its three parts.
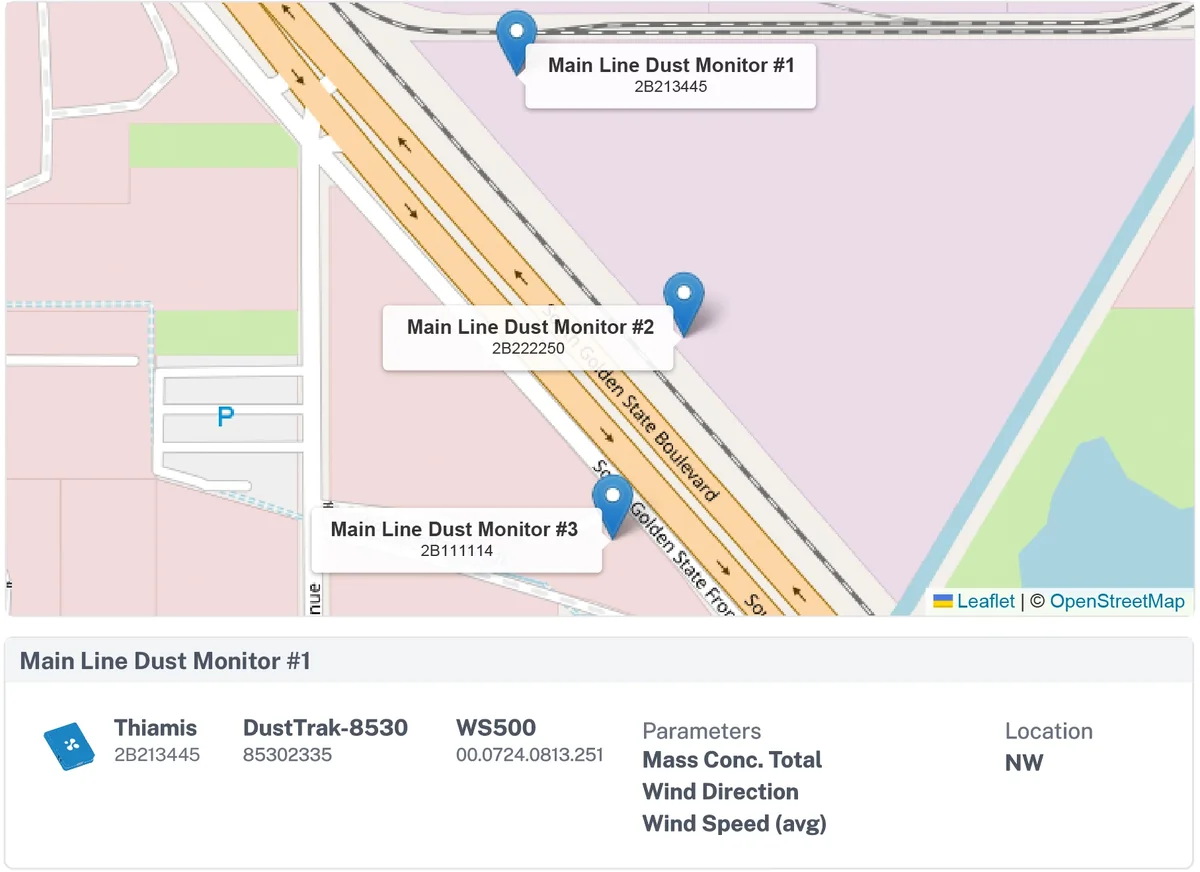
Site map and devices
A mapped overview of the site: where every monitor stands, what it is, and which parameters it reports.
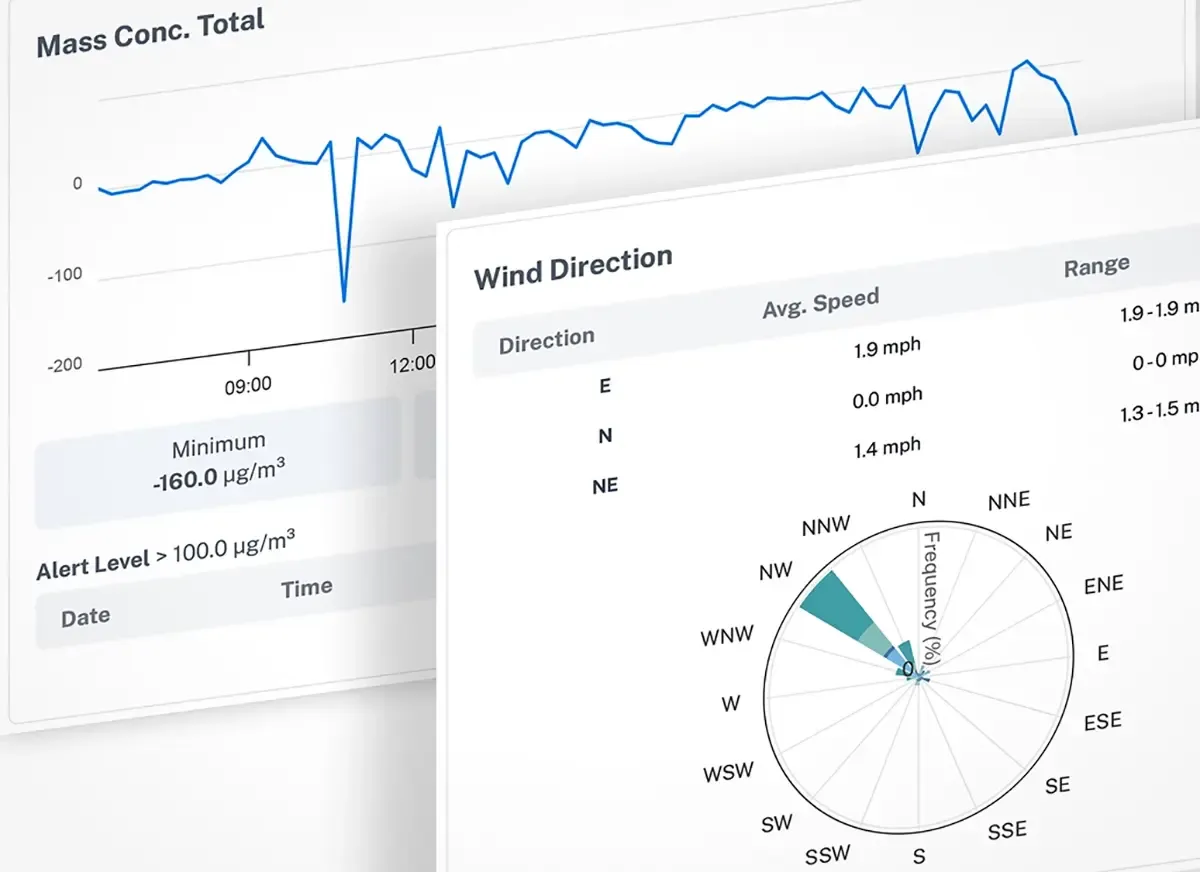
Impact assessment
Total mass concentration over the period, minimum, maximum and average, the alert-level events, and the wind direction behind them.
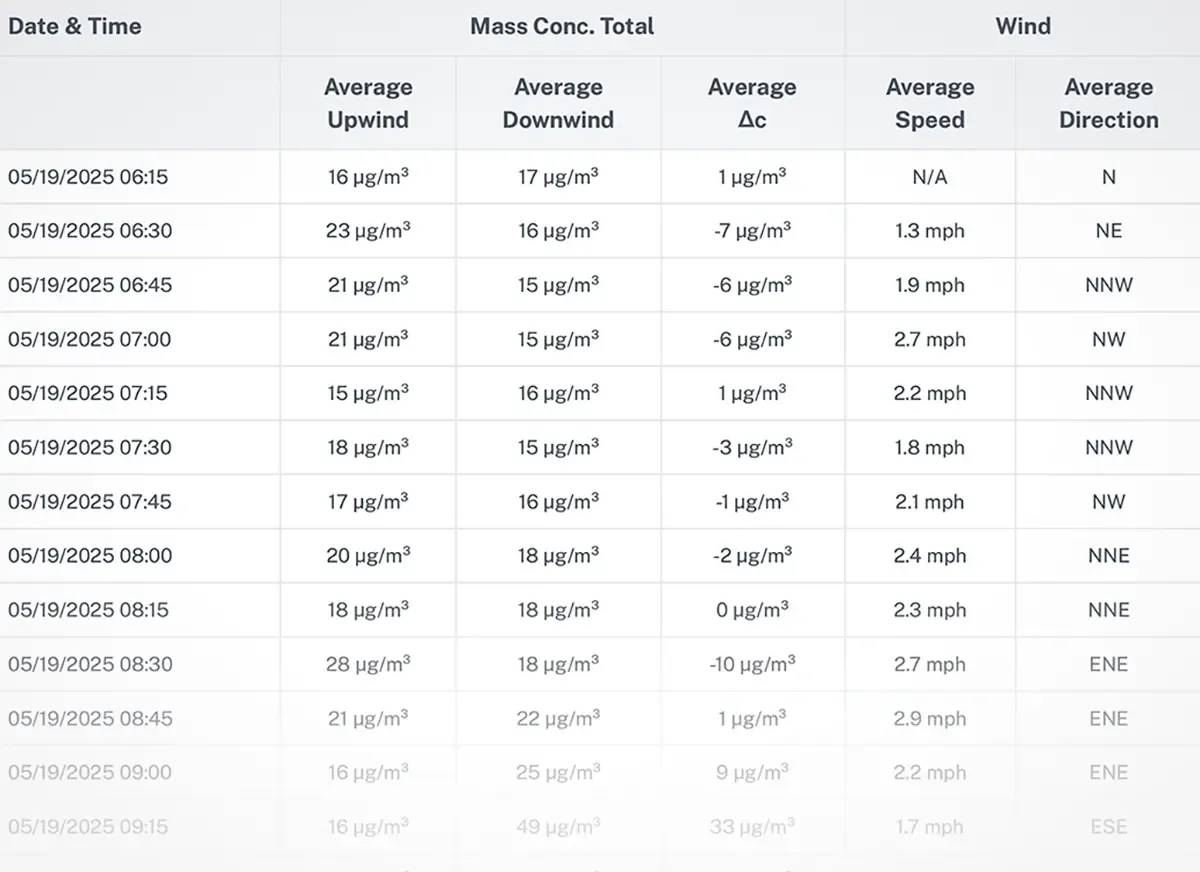
Data table
The mass concentration totals with wind at the project's averaging interval, useful for submissions, audits, retention, and compliance.
Ask the data
Smarter Perimeter Monitoring with Noesis
Weeks of readings from a dozen boundary monitors are more than anyone reviews line by line. Noesis, the AI analyst in Environet, does that review: ask a question and it finds the exceedances, the trends, and the anomalies in your own data, which cuts the manual review behind a report and supports the decisions that follow.
By sector
Boundary Monitoring Beyond Construction
The same monitors guard other kinds of boundary. Each of these is the same platform with a different panel, standard, and report.
Outdoor and ambient networks
PM2.5, PM10, and gases against NAAQS across a neighborhood or a region, on the same Aethair PRO.
Construction noise
Leq, Lmax, and statistical levels at the boundary, for sites whose permit sets a noise limit as well as a dust one.
Oil, gas, and refinery fencelines
VOCs, hydrogen sulfide, methane, and combustible gas at an industrial fenceline, where the regulatory term is fenceline monitoring.
City-wide monitoring
A municipal network of the same monitors, from traffic corridors to school zones.
Article Library
Reading for Perimeter and Fenceline Programs
Guides to the rules and practices behind boundary monitoring on construction and industrial sites.
Industrial Perimeter Air Quality Monitoring: Action Levels
What industrial perimeter monitoring requires at fenceline and construction sites: DER-10 CAMP action levels, EPA fenceline rules, and continuous records.
Fenceline Air Quality Monitoring: Equipment and Approaches
Compare fenceline air quality monitoring approaches: standalone stations, pelican-case kits, and connected 4G sensor networks.
Data Center Air Quality Monitoring, Inside and Out
Data center air quality monitoring for operators: ISO 14644 cleanliness in the white space, construction dust, generator emissions, and perimeter noise.
OSHA Air Quality Standards 2026: PELs & 29 CFR 1910.1000
OSHA air quality standards for indoor and outdoor work: permissible exposure limits, Table Z-1, 29 CFR 1910.1000, and the heat and wildfire smoke triggers.
How to Generate Air Quality & Compliance Reports
Learn how to generate air quality and environmental compliance reports from monitoring data, plus how automated and AI air quality reporting work.
How to Choose an Air Quality Monitor: PRO, IAQ, or Thiamis
Compare Aethair PRO, IAQ, and Thiamis to match the right device to your site, from commercial interiors to industrial and fenceline monitoring.
Questions
Perimeter Air Monitoring and Fenceline Monitoring FAQ
What is perimeter air monitoring?
Perimeter air monitoring is the continuous measurement of dust, particulate matter, and gases at the boundary of a construction site, industrial facility, or other active job site. It documents whether work on site is affecting air quality at the boundary and in the community beyond it: the record that permit conditions, a DER-10 Community Air Monitoring Plan, or a local dust rule asks for.
What is the difference between perimeter monitoring and fenceline monitoring?
Both mean continuous monitoring at the boundary of a site, and the terms are often used interchangeably. Fenceline monitoring is the usual term at refineries and chemical plants, where EPA rules prescribe it: at refineries under 40 CFR 63 Subpart CC with passive benzene samplers (EPA Method 325A/B), and at chemical plants under the 2024 HON rule. Perimeter monitoring is the usual term in construction. Aethair PRO serves both.
How does construction dust monitoring work?
Aethair PRO measures PM1, PM2.5, PM10, and total PM continuously at the boundary, with gas sensor cartridges for VOCs or a specific gas. Readings stream over 4G LTE to Environet, where a reading above a trigger level raises an alert, and Aethair Reports writes the perimeter report from the same data.
Can Aethair integrate with third-party sensors already on a job site?
What standards does construction perimeter monitoring need to meet?
It depends on the site: the trigger levels in its permit or planning conditions, a New York DER-10 Community Air Monitoring Plan (PM10 more than 100 µg/m³ above upwind over 15 minutes calls for dust suppression), and local agency rules. The NAAQS PM2.5 values (9 µg/m³ annual, 35 µg/m³ 24-hour) are used as reference values. Worker silica exposure is judged against the OSHA limit of 50 µg/m³, measured by personal sampling rather than at the fence. Aethair Reports applies the levels you configure to the readings.
How quickly can perimeter monitors be deployed on a job site?
Aethair PRO ships calibrated, reports over its own 4G LTE, and can run on solar power with the Solar Panel Bracket, so deployment is mount and power on: there is no site network to join, and the readings appear in Environet as soon as it is running.
Does perimeter monitoring data support compliance reporting?
Yes. Every reading is time-stamped and kept in the continuous record. Aethair Reports produces the perimeter report from it (site map, impact assessment with alert-level events and wind, and the data table) on demand or on a schedule for regulators, agencies, or clients.
What dust levels are allowed on a construction site?
There is no single universal figure. Dust limits are usually set as local trigger and action levels in the site's permit conditions, expressed as PM10 (and sometimes total dust) concentrations at the boundary. Real-time monitoring against a trigger level set below the hard limit is what lets a site act before it breaches.
Why monitor wind alongside dust?
Because it answers the question that always follows a dust spike: was it us? When an exceedance coincides with wind blowing from the working area toward the monitor, the dust is attributable to the site; a spike with wind from the opposite direction points to an external source. Without wind data, boundary dust readings are hard to defend.
Do I need to monitor silica separately from dust?
Yes, where concrete, stone, or masonry is cut or ground. Respirable crystalline silica is a specific, strictly limited health hazard that a general dust reading cannot quantify. It requires size-selective, crystalline-specific gravimetric sampling for worker-exposure compliance, alongside real-time respirable-dust monitoring for control.
What is the best monitoring setup for a construction site?
A boundary station combining real-time PM10, PM2.5, and total dust with noise (Leq) and wind speed and direction, alerting against local trigger levels. Add respirable-silica sampling where relevant. Use the configurator to build and customize the configuration for your site.
Put Your Site Boundary on the Record
Schedule a ConsultationThe perimeter monitoring guide Aethair PRO Thiamis Build a Configuration
A 30-minute call: you tell us about your application, then we demo the solution for it.
Used by teams at