Aethair software
Noesis
AI Assistant for Environmental Compliance and EHS Reporting
What you ask it
Ask, Analyze, Report, Configure
Four kinds of request, all in plain language, all answered from the readings already in Environet.
Ask a question
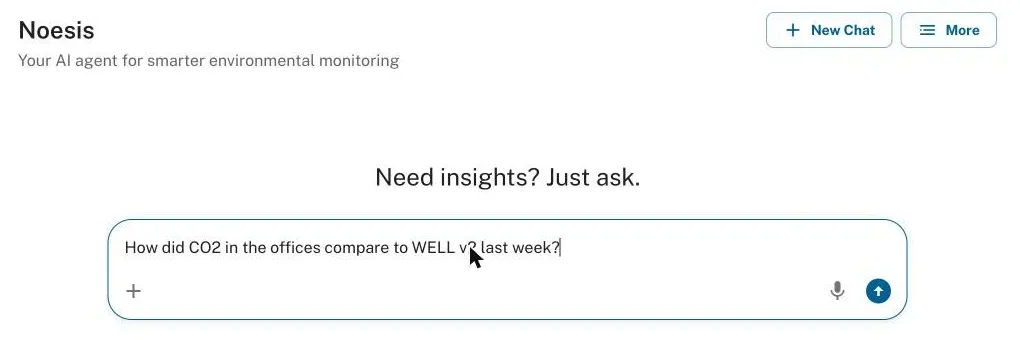
“Which sites showed the highest PM10 today?” Noesis queries the live and historical readings and answers the question as asked.
Analyze a period
Months of readings across many devices, with trends and anomalies pointed out.
Produce a report
Generate a perimeter, indoor, or cabin air report through Aethair Reports and get a plain-language summary of what it shows: the standard, the thresholds, and where readings crossed them.
Configure by describing
Describe the dashboard, report schedule, or alert you want, including multi-condition alerts at the thresholds you name, and Noesis fills it in for you. You review it and can change anything afterwards.
How it works
Works on the Data Already in Your Account
It reads the thresholds and the standards you have configured as well as the readings, so nothing has to be exported or prepared first. What it produces lands where you would have built it by hand: an answer in the console, a finished alert or dashboard, or a report in Aethair Reports. When you ask for an alert or a dashboard, it fills in the form for you, a head start instead of clicking through every field, and you can change anything in it afterwards.
What comes back
An Analysis Built From Your Own Readings
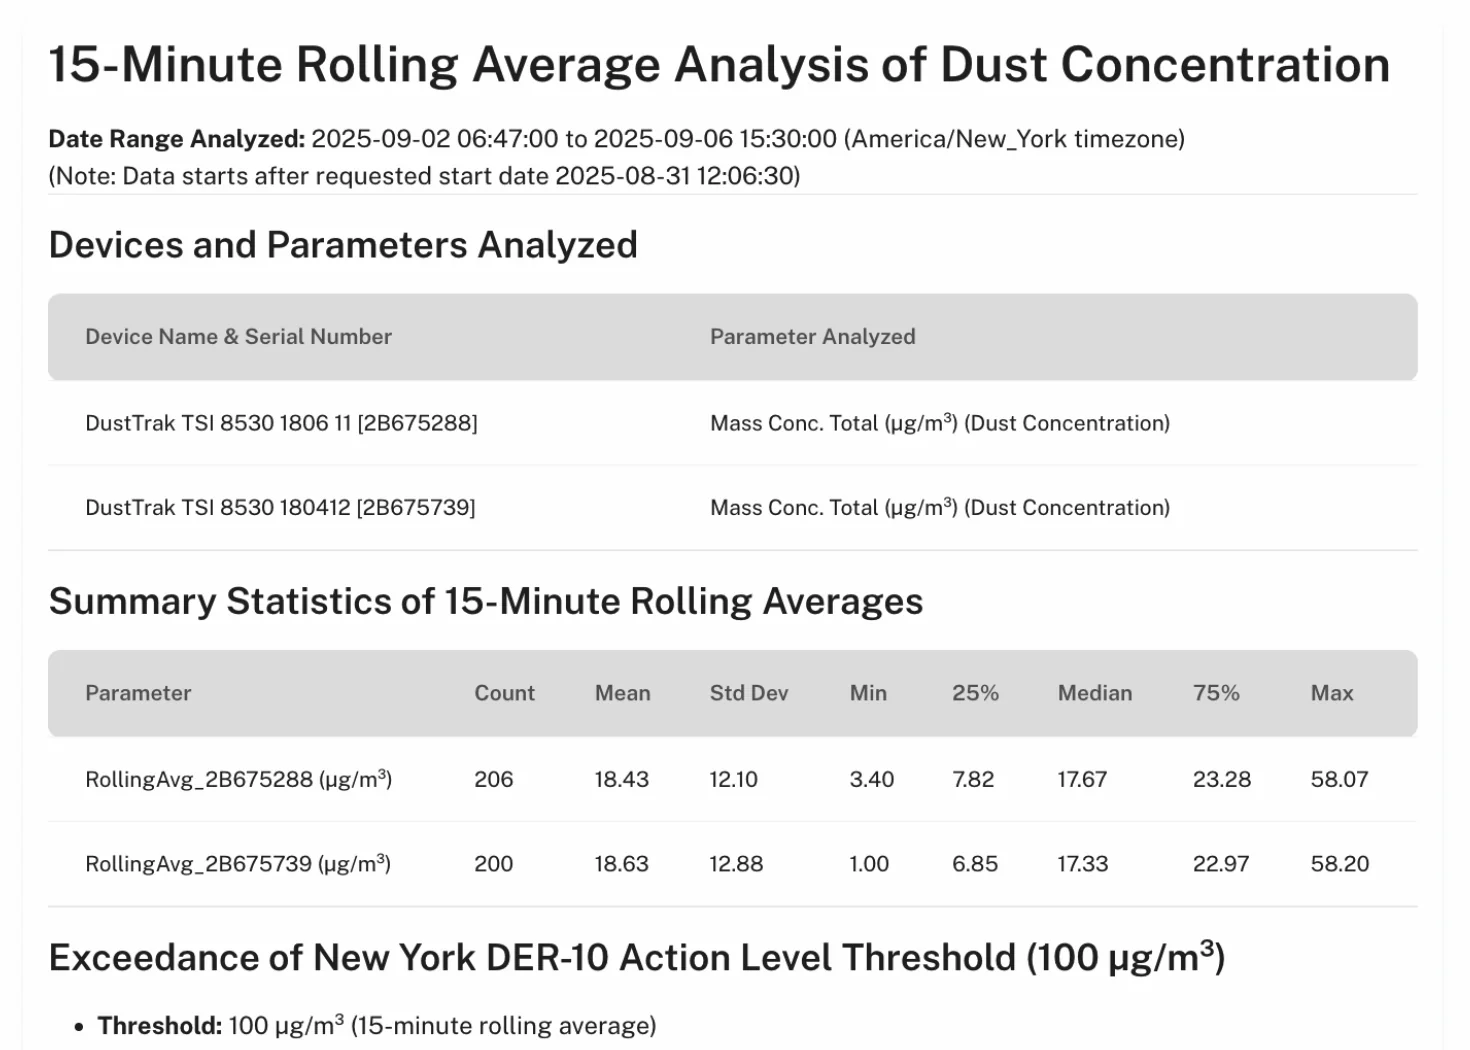
Noesis returns a full analysis on the page, starting with the date range, devices, and parameters it used, so you can check exactly what went into it. A request for a 15-minute rolling average of dust from two DustTrak monitors against a 100 µg/m³ threshold comes back with summary statistics for each monitor and every exceedance.
New York's DER-10 sets its dust action level for PM10 at 100 µg/m³ above the upwind reading over 15 minutes. For a DER-10 plan, you would ask the same question of the difference between the downwind and upwind monitors, a derived channel you set up in Environet.
See it work
Noesis in Action
Short recordings from the Environet console, each showing one task from start to finish.
Article Library
Reading on Noesis in Practice
Guides on putting AI analysis to work on monitoring data.
AI Air Quality Monitoring for EHS and Compliance Teams
How AI changes air quality and environmental monitoring, from anomaly detection and prediction to automated reporting, and where it helps EHS teams.
What Is Environmental Intelligence? Definition & Use Cases
Environmental intelligence turns real-world environmental data into decisions you can act on and defend. Learn how platforms combine monitoring and AI.
How to Generate Air Quality & Compliance Reports
Learn how to generate air quality and environmental compliance reports from monitoring data, plus how automated and AI air quality reporting work.
Wildfire Smoke Air Quality Monitoring: Detection & Response
Wildfire smoke monitoring for EHS and public health teams: real-time PM2.5, the AQI 151 respirator trigger, and how to alert workers before smoke arrives.
EHS Compliance Reporting Guide: Defensible, Audit-Ready Data
EHS compliance reporting needs defensible, audit-ready documentation. Build a workflow that holds up to OSHA and EPA audits and NAAQS benchmarks.
IAQ Monitoring Parameters: PM2.5, CO2, VOCs & Formaldehyde
Indoor air quality monitoring parameters explained: PM2.5, CO2, VOCs, and formaldehyde, plus the sensors, thresholds, and OSHA, ASHRAE 62.1, and WELL limits.
Questions
Noesis FAQ
Is Noesis a separate product from Environet?
Does Noesis work on third-party instruments?
What happens to our data when Noesis uses it?
Where do I find Noesis?
Ask Noesis About Your Data
Schedule a callAccess on Environet Aethair Reports Environet
A 30-minute call: you tell us about your application, then we demo the solution for it.